
How I Eliminated the Black Vote in Georgia in One Easy Step
You won't believe how bad the Roberts Court's gutting of voting rights is until you see it in these redistricting maps I made

The first thing I did was take out Atlanta.
The Atlanta metro area of Fulton County, the bane of Republicans in every Georgia election, is now mostly eliminated. Then I stuck some racist fingers into Savannah, and neutered it, too. I even took out Augusta and Columbus.
I was able to accomplish this by simply visiting a publicly available redistricting map construction site, and boom! Georgia is now red again. And not that purply red that it’s been the last decade or so.
Nope. We’re talking deep, deep red, just in time for the midterms. Goodbye contraception, hello Aunt Lydia. Goodbye to our Latino friends. Say hello, everyone, to the Incarcerated States of America. Enjoy Apartheid? You’ll be happy in the new country that the John Roberts court is trying to forge.
The Supreme Court made all that possible this week when it gutted the Voting Rights Act. Read Joyce Vance’s summary of this corrupt decision referenced in the footnotes1 if you aren’t yet familiar with the Roberts Court’s most recent blatant escalation of American racism, fascism, and corruption.

The decision they rendered last week, Louisiana v Callais, which grants states the right to gerrymander without regard to its effects on minority voters, might be their worst yet, which is a remarkable touchstone.
Last week, Georgia Governor Brian Kemp hailed the decision and announced that the state would try to redistrict in time for the 2028 presidential elections. Many Republicans in the state are demanding a special session to redistrict in time for the midterms, but primary voting has already begun. So far, Kemp has declined the opportunity.
This article is about the consequences of the Supreme Court’s horrific decision.
Playing the role of the evil empire, I created a Georgia redistricting map that takes maximum advantage of the Supreme Court decision.
Even without the help of AI, I was able to ruin Democrats in a few hours by using an online tool. Legislators using AI can probably do it in minutes. They simply need to enter a few parameters and send a tool like Claude to the tool’s website to render a map.
My map is greatly flawed. It’s just a demo, but it’s a comprehensive demo to reveal the danger we are in. This is one of those rare things AI would do better, because all you need to do is check its work and redo it until it gets it right.
It’s not just about racism, either. Using the tool, legislative mapmakers can redraw legislative districts based solely on voting patterns so that, for example, Republicans hold every seat.
The only thing that has stopped Republicans from redrawing maps in this way in the past is that Black majority areas of their states got in their way. This problem has ended. State lawmakers can now create new maps at will however they please, with no regard at all for the few rules remaining in the Voting Rights Act, which has just been all but nullified by the Supreme Court.
Visualizing the extreme effect of the Supreme Court’s ruling
To understand the ramifications of the Supreme Court’s decision to reestablish the old Jim Crow South, it helps to visualize how easy the Supreme Court made it for Southern state legislators to cook up new legislative districts that completely shut out the Black vote.
I used a website called districtr.org, which, ironically, appears to be designed for progressive activists. It contains a tool that makes it easy for anyone to build a map of absolute destruction, so I did.2
The website provides an editable map featuring every congressional district in the United States, along with every voting precinct in the nation (each Congressional district contains numerous precincts).
The United States House of Representatives currently consists of 435 voting members and six non-voting members. Each state has a static number of legislative districts. For example, Georgia has 14. State legislators cannot change this number.
They’re supposed to divide the districts up proportionally. When I created the map, I didn’t stress about that too much, since it was just an experiment, and I didn’t have access to computer analysis tools to help me manage the distribution.
I used Georgia as my test bed because I live there. Legislators in Mississippi, Alabama, and other Southern states will probably create more mayhem than Georgia legislators, but I created the map as if Georgia’s Republican majority in the state legislature would go bonkers and basically end voting for Blacks in Georgia. Because they will certainly try.
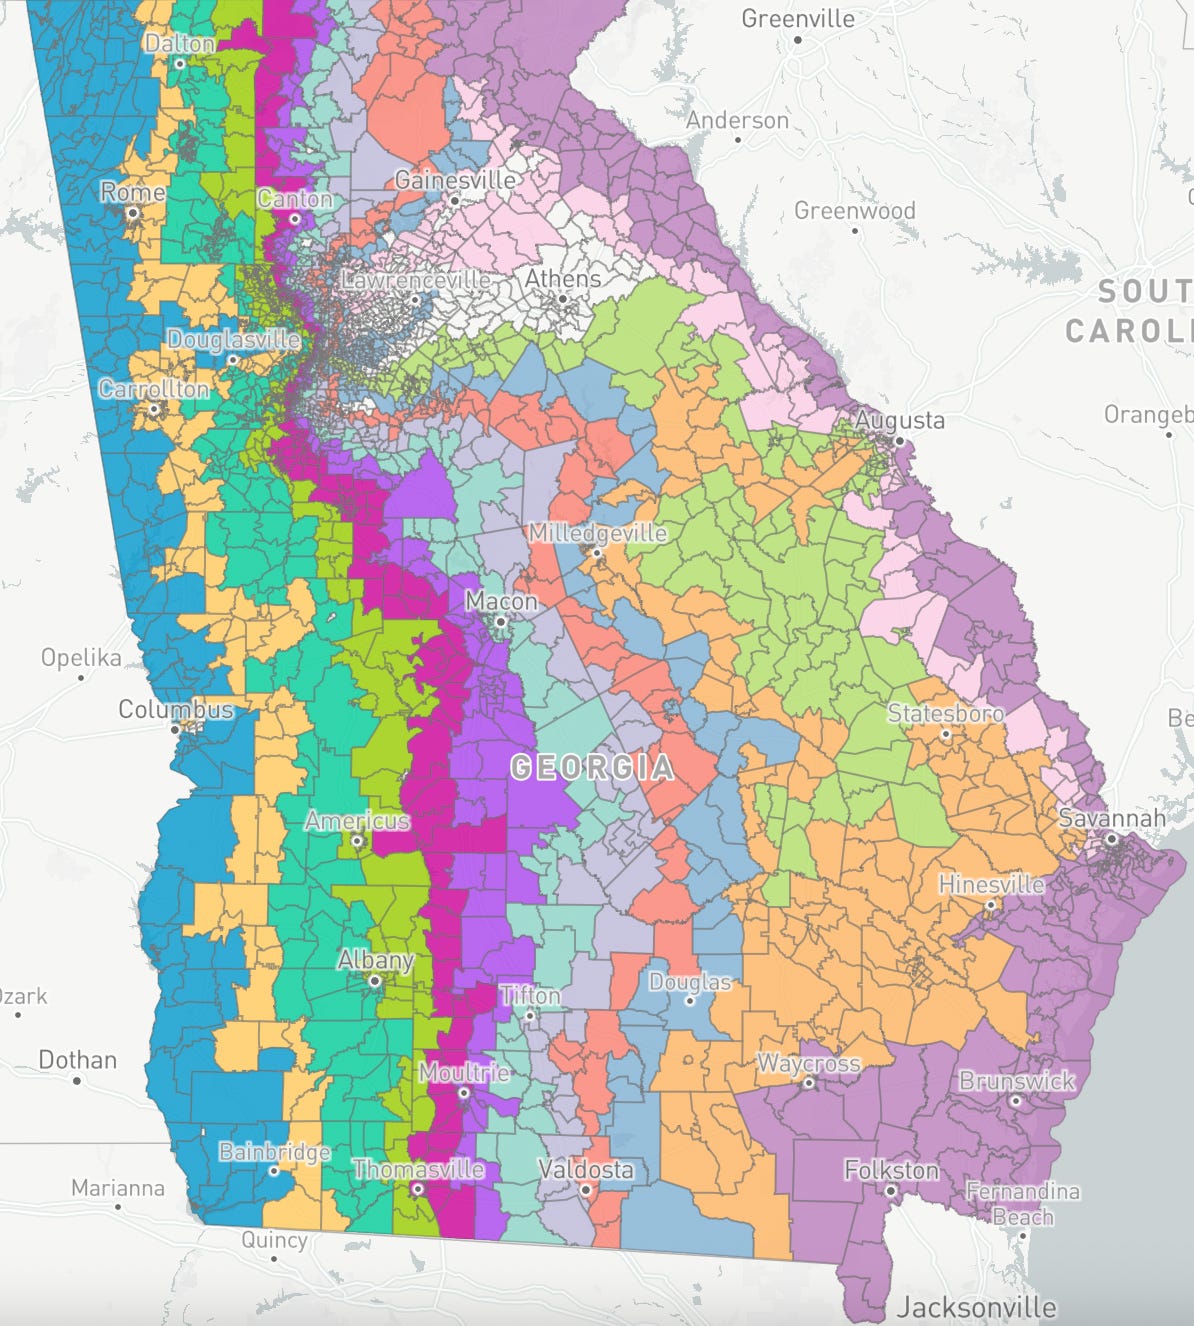
I started with the current legislative map.
This is the map I started with. It’s the current map that would be used if the election were held today:
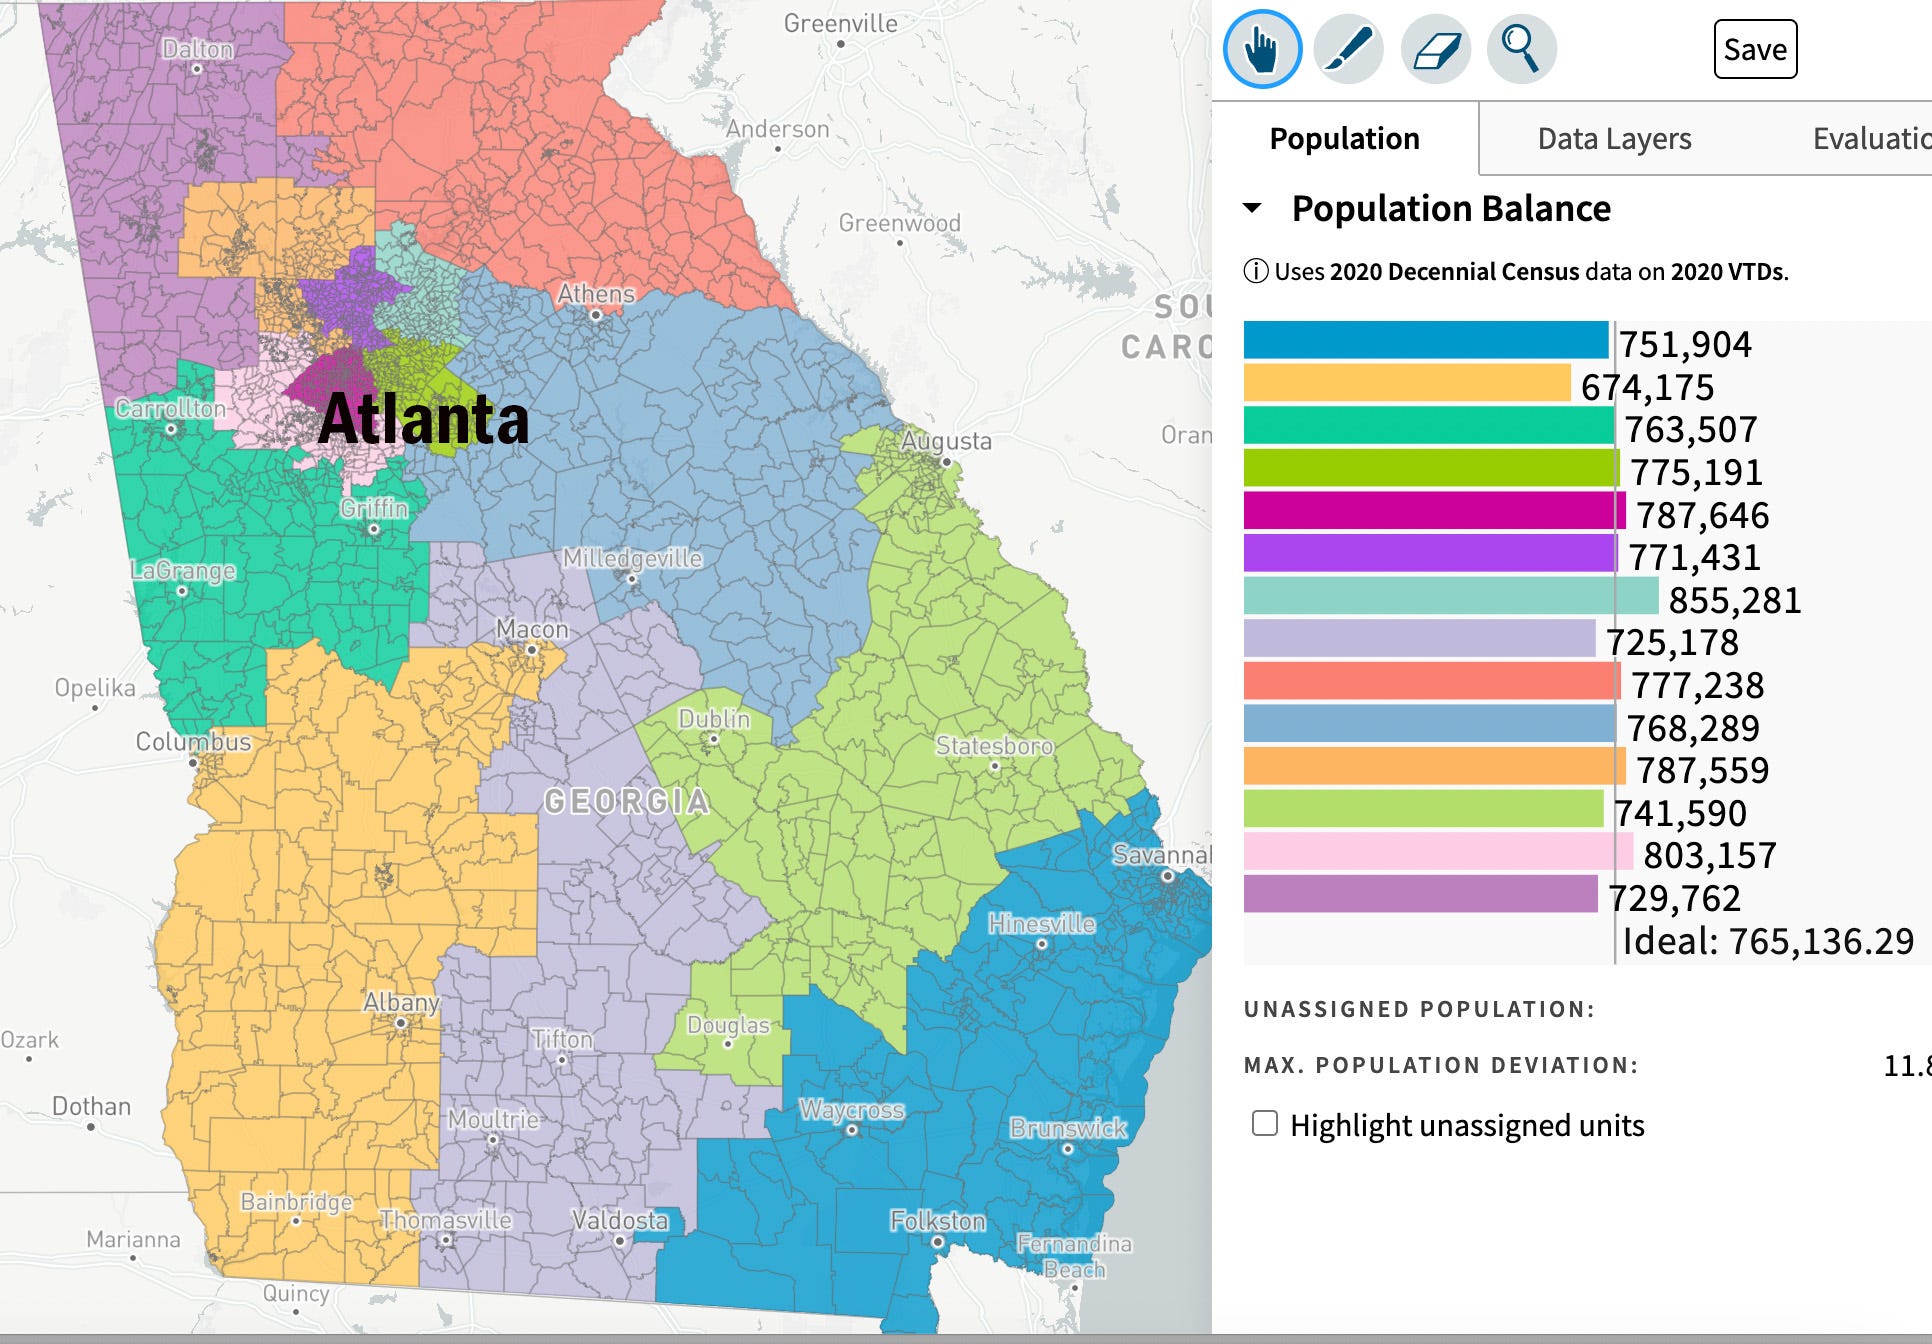
Atlanta’s main voting district is the purple one, Georgia’s 5th Congressional District, with 787,646 residents, according to the U.S. Census data used by congressional district map makers (this is by law; they must use 2020 Census Data to redraw maps3).
The district to the right of Atlanta, just east, consists of the city of Decatur. This is Georgia’s 4th Congressional District. It has 775,191 residents. Both of these districts have large Black populations and vote deep blue every election. Whites who live in these two districts also vote reliably Democratic.
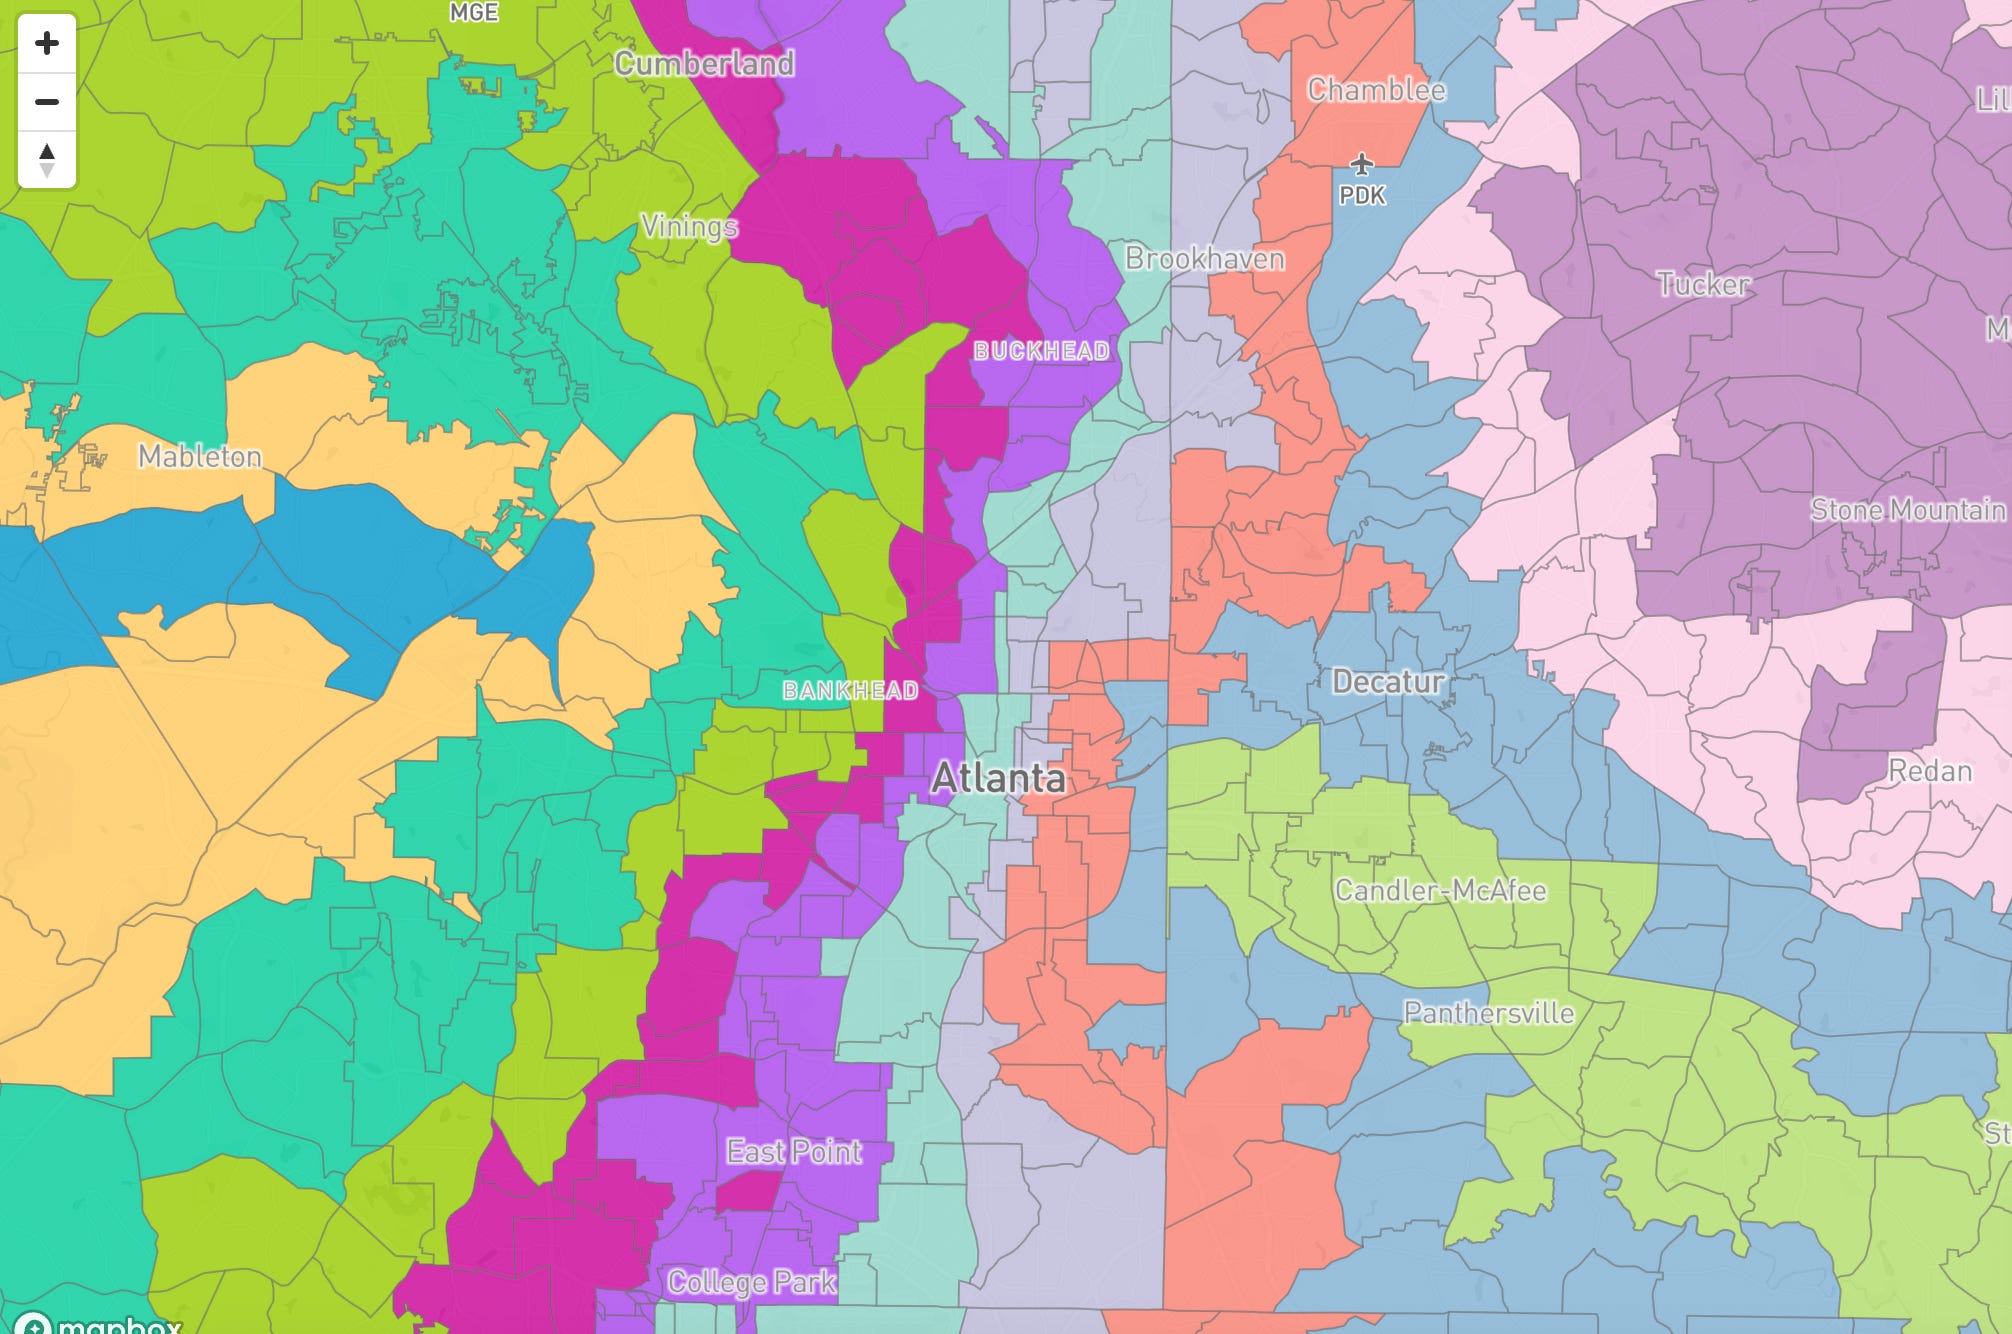
Let’s zoom in on the Atlanta area to see what the boundaries of the Atlanta metro area’s legislative districts look like today:
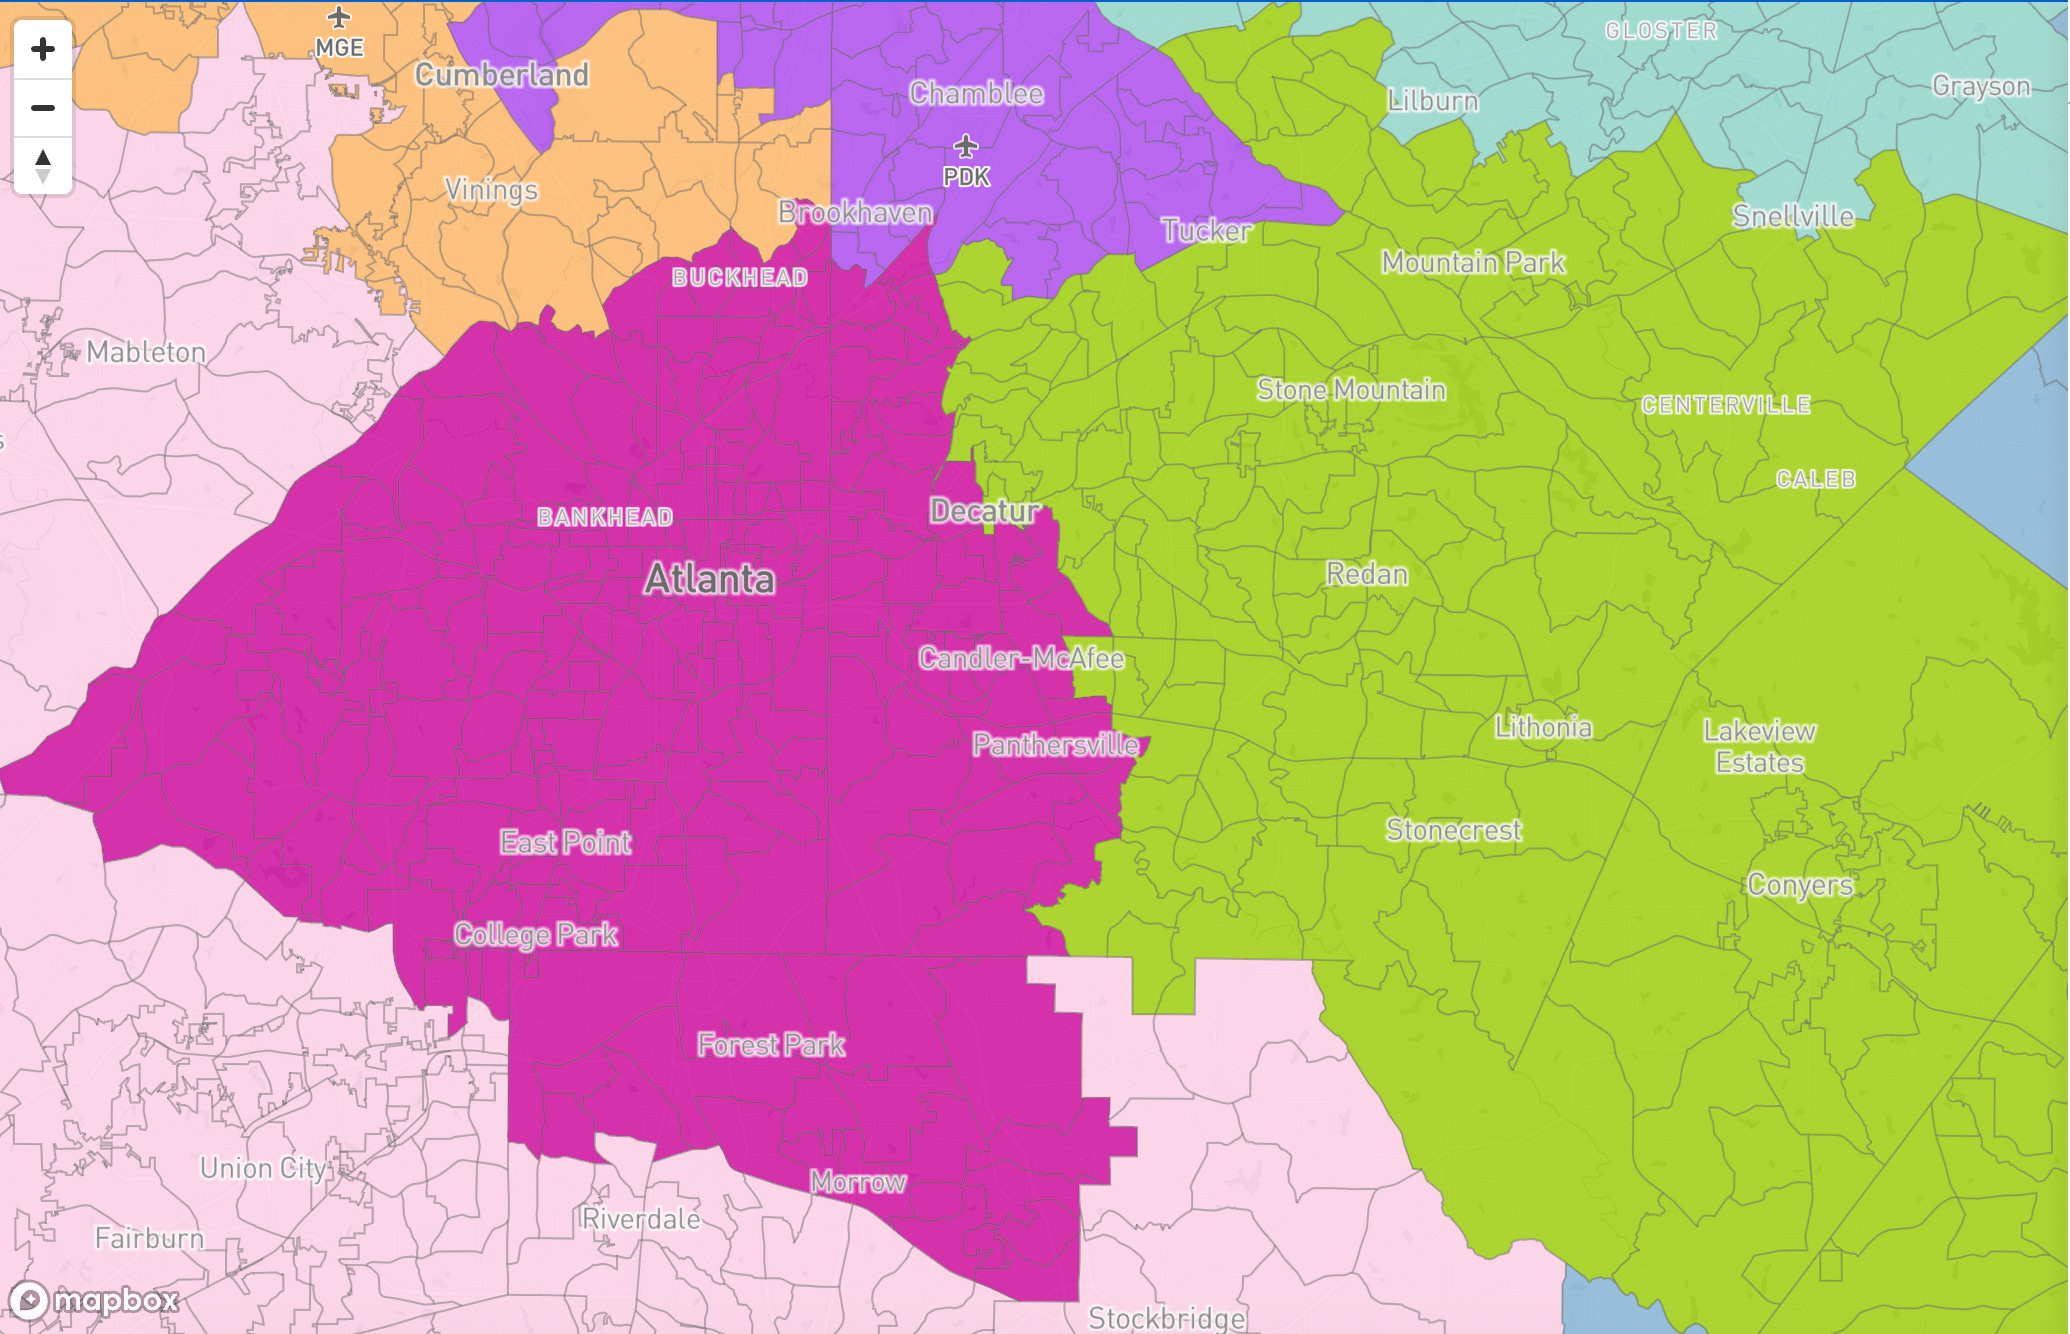
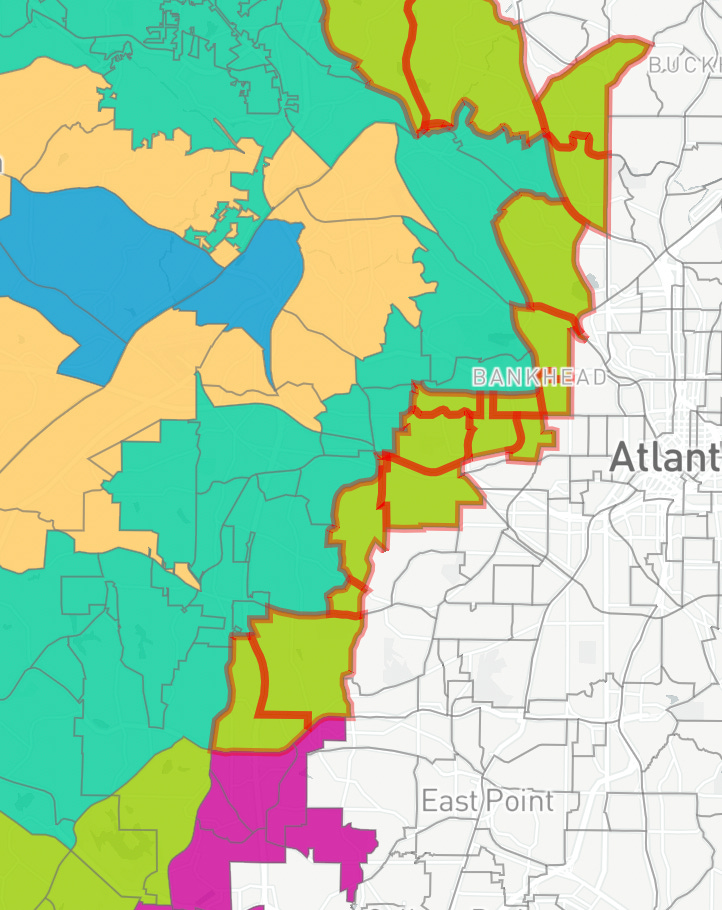
As you can see, it looks fairly normal. It’s not the spaghetti western that it’s about to become. Now, let’s look at what I’ve done with it thanks to the Supreme Court:
Holy expletive, Charles, what did you just do to Atlanta?
I chopped it up, is what I did. I filleted it, then ran some snakes through it. All of it quite legally, thanks to your pals in the Supreme Court.
Not only did I chop Atlanta up, but I sent District 5, legendary civil rights activist and Georgia congress critter John Lewis’ old district, deep into Georgia’s rural country, where it can mingle with good old boys driving those goofy pickup trucks with diesel stacks sticking out of the bed.

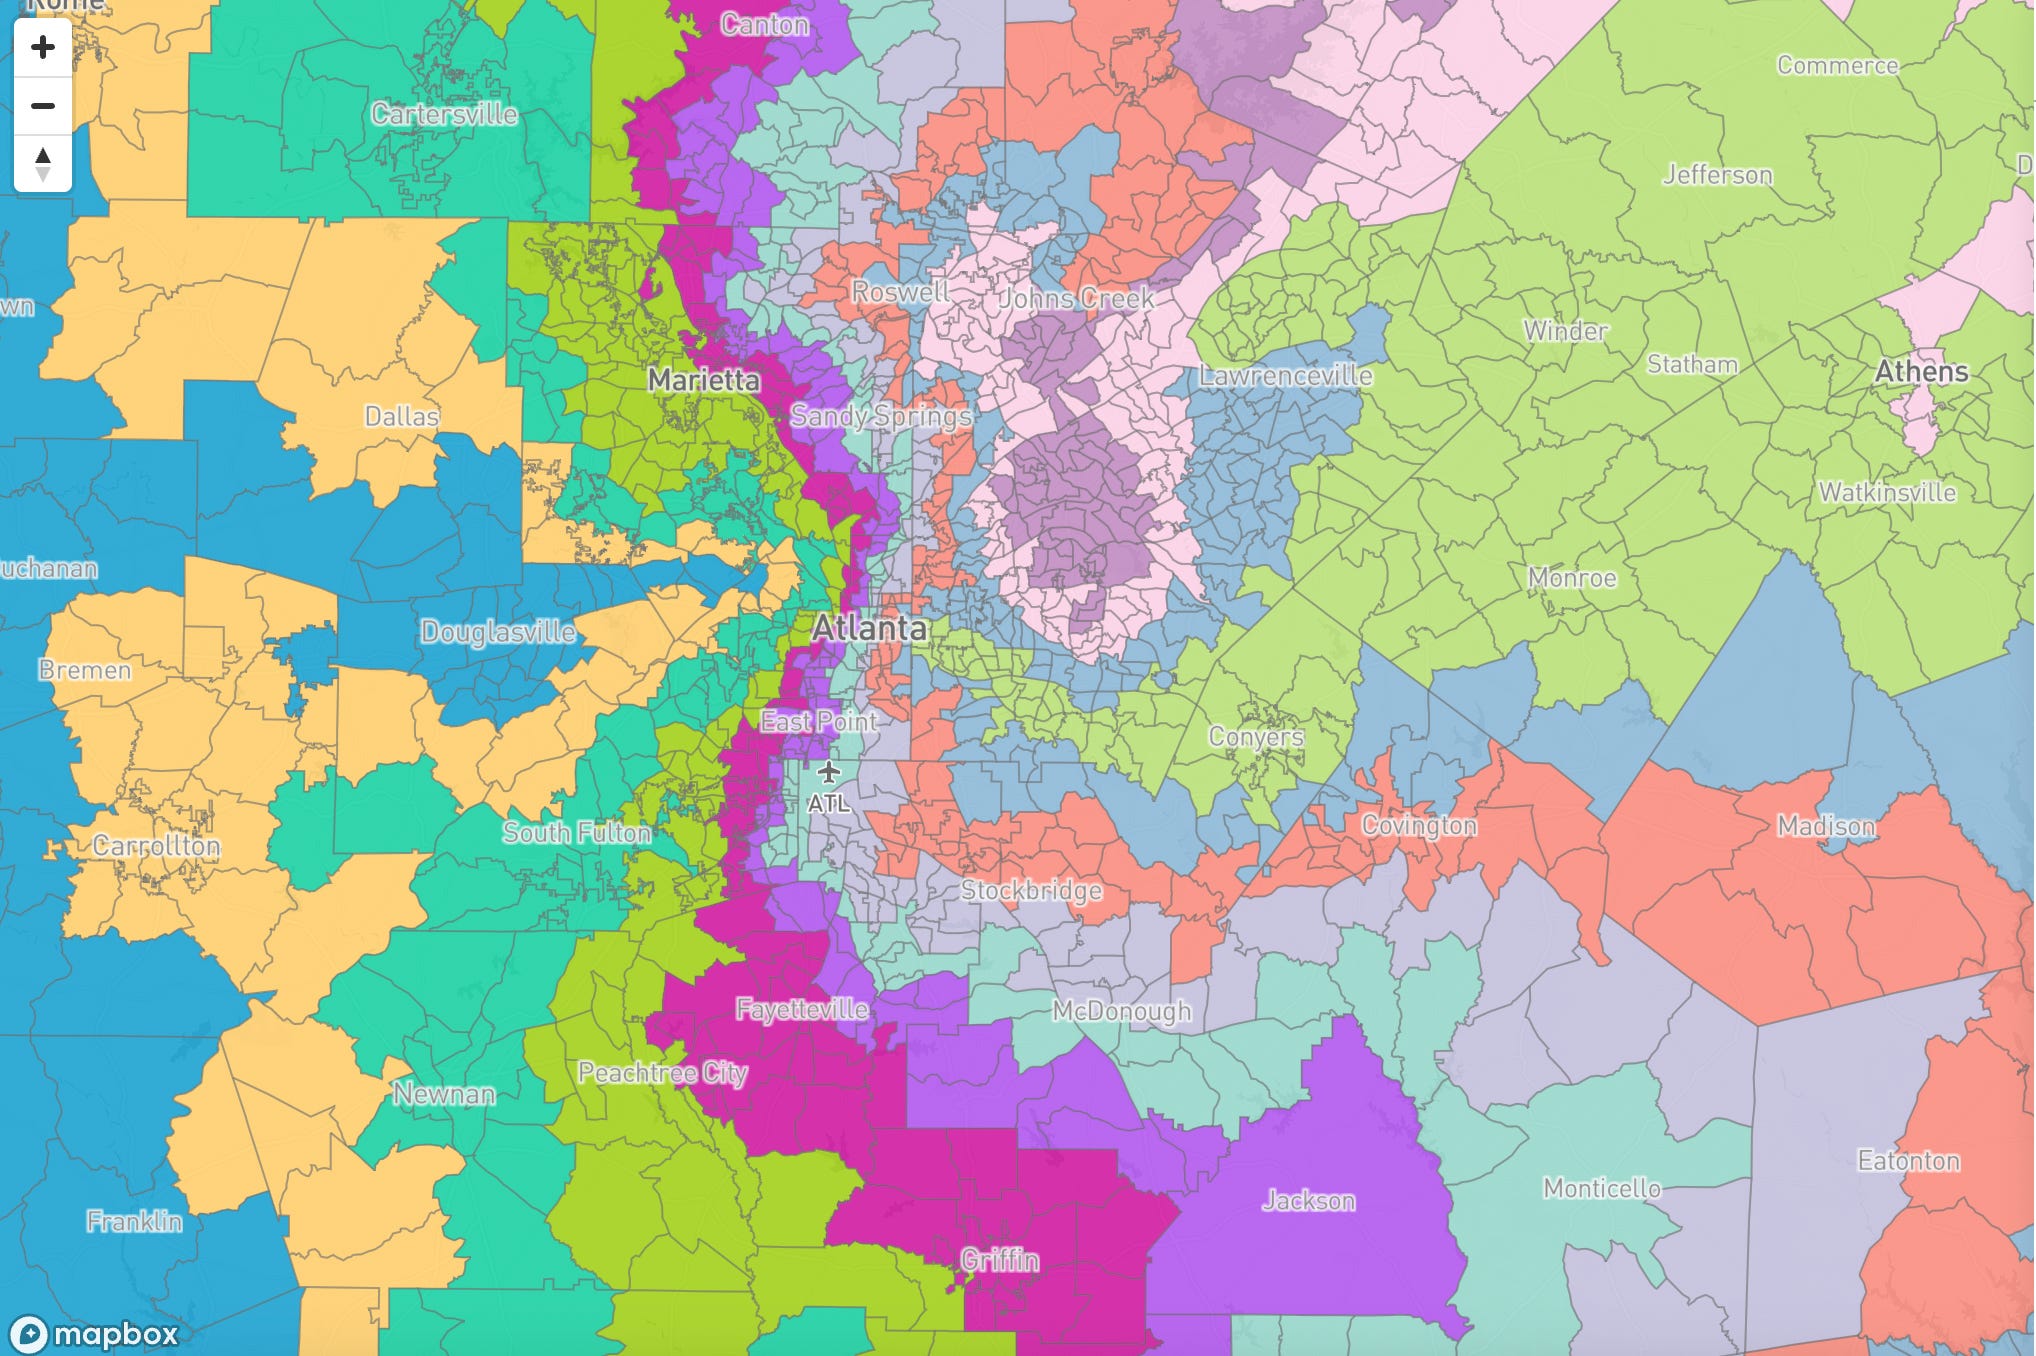
Let’s zoom out to review the destruction to John Lews’ former district I have wrought in my role as evil Republican mapmaker:
I know, I know, it’s a big mess! But that’s the beauty of the new ruling. No rules! Anything goes, and if a legislative body wants to snake around a state and turn it into a jigsaw puzzle, it can, especially if it wants to suppress the Black vote. Again.
District 5 is now a tiny ribbon as it expands northward out of rural areas. Out of view in this graphic, it expands again into northern rural areas. It is a husk of its former civil rights self. What was once a legendary and powerful Atlanta-based legislative district, thanks to the original intent of the Voting Rights Act, is now a reminder of Jim Crow and the Roberts Court’s legacy of racism.
Who was John Lewis?
John Lewis was one of the most important civil rights leaders in American history, serving 17 terms as a member of the U.S. House of Representatives. He marched on Selma, invented the term “Good Trouble,” and changed American history in ways that we are, sadly, watching people like John Roberts upend.
Lewis was one of the original 13 Freedom Riders: seven blacks and six whites determined to ride buses together through the deep south in the early 1960s when Blacks were forced to ride in the back of buses.
John Roberts wants you to believe that now that this practice is theoretically dead (you can be sure that in some Southern counties it is not), racism has been expunged from the American experience. He knows his legal claims are a lie. He uses the legal catacomb of obfuscation to present his case, which his liberal colleagues on the court, as explained in Joyce Vance’s article, reject with vigor, so that history will hold Roberts accountable even though the American public does not.
The end of civil rights in elections is exemplified by the following instructions on the remapping website. Note that I “Xed” part of the directions out, the important part, because it no longer applies:
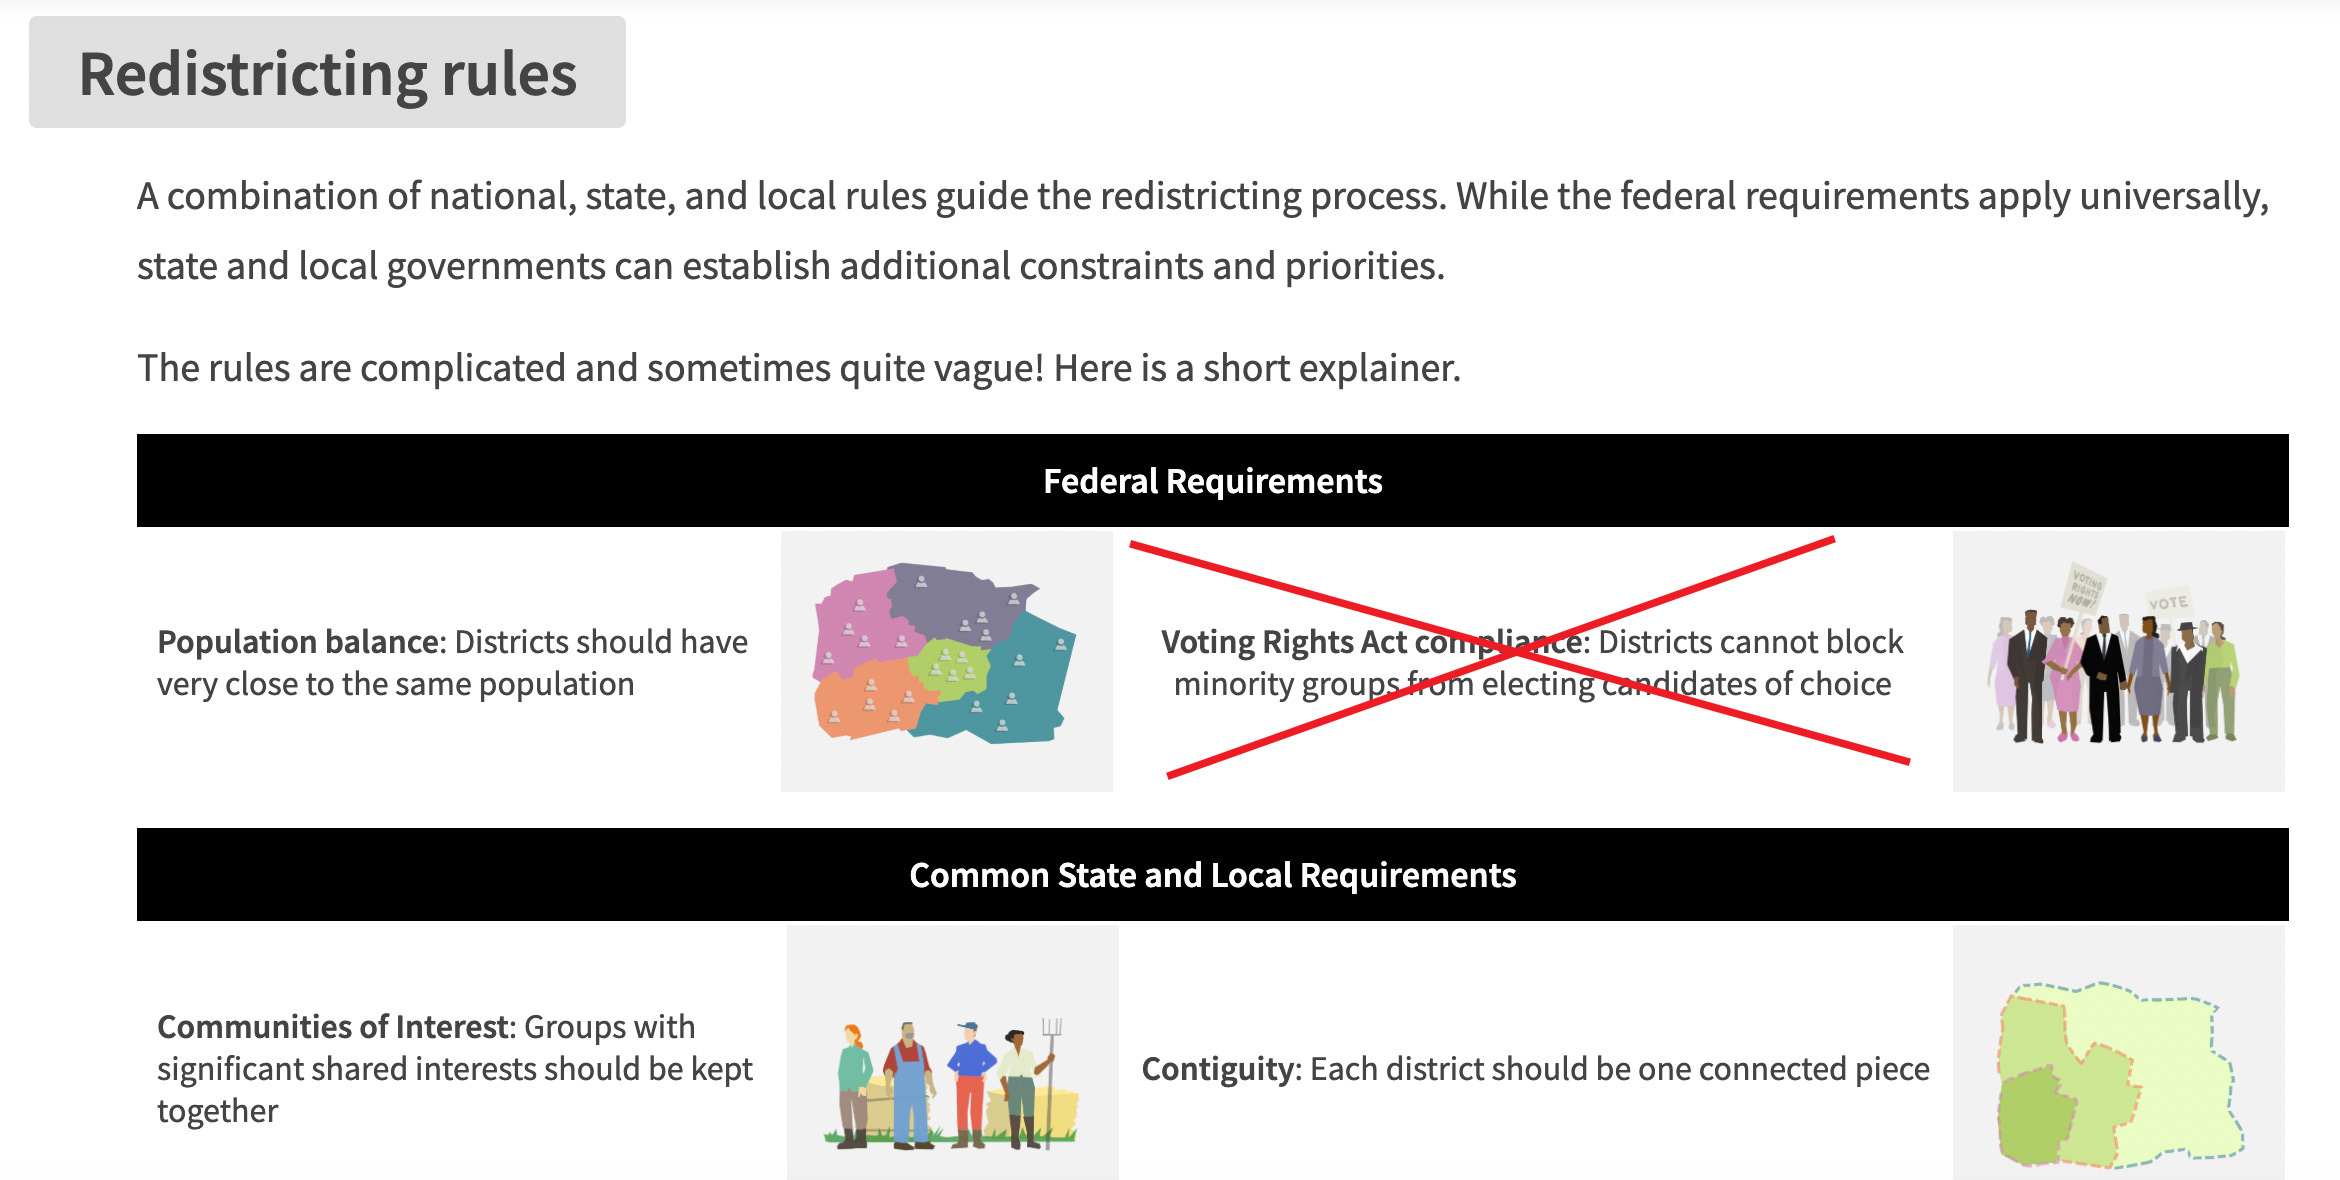
The only rule I really had to pay attention to was “Contiguity,” but even that rule can probably be circumvented with some good, old-fashioned Southern lawyer snookering. So, when I created the map, I tried to make sure each district was contiguous. This led to some mesmerizing sleight of hand, like this:
Chop, chop chop! Republicans can now slither their way around the map and slice up big cities to their content. Imagine what they’ll do to Memphis, Birmingham, and other big southern cities in states they control.
The newly formed ribbons wind their way around Atlanta before moving south into gloriously large expanses of rural areas. After they stick their racist fingers into the Atlanta metro area, most of them move north back into conservative rural counties.
I didn’t care if one corner of a precinct lightly tapping a corner of another precinct was the only thing that made the whole district contiguous. Legislators can now get as blatant as they want, and there’s nobody left to stop them. This little exercise reflects that fact.
You might reasonably contend that this is ridiculous, but it’s not much more extreme than what Texas has already done. Take a look at blue Austin, which has been sawed into several pieces by Texas Christo-nationalists and joined with its surrounding red counties:
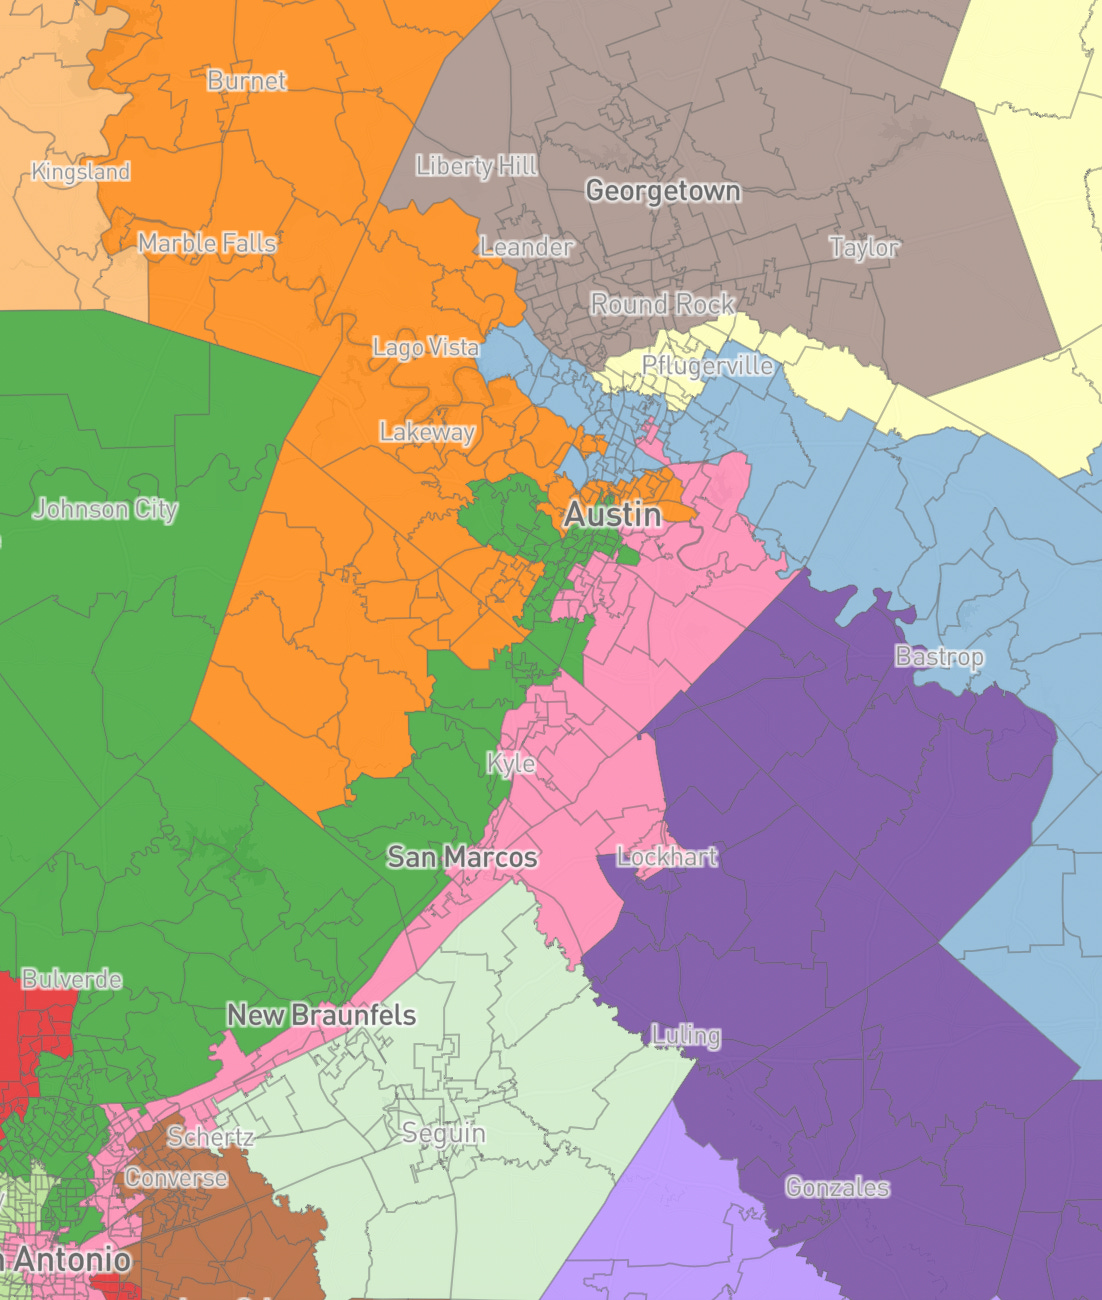
The concept is simple: Dilute the urban areas with rural votes. Split up the urban areas into multiple districts that stretch across the entire state, or, at the least, enough surrounding rural counties to nullify the Democratic vote.
Democrats are talking about doing the opposite in Illinois, where legislators are fantasizing about ribbon districts that eliminate the Republican vote. Here are three of them, drawn randomly and unscientifically (by me) on a map:
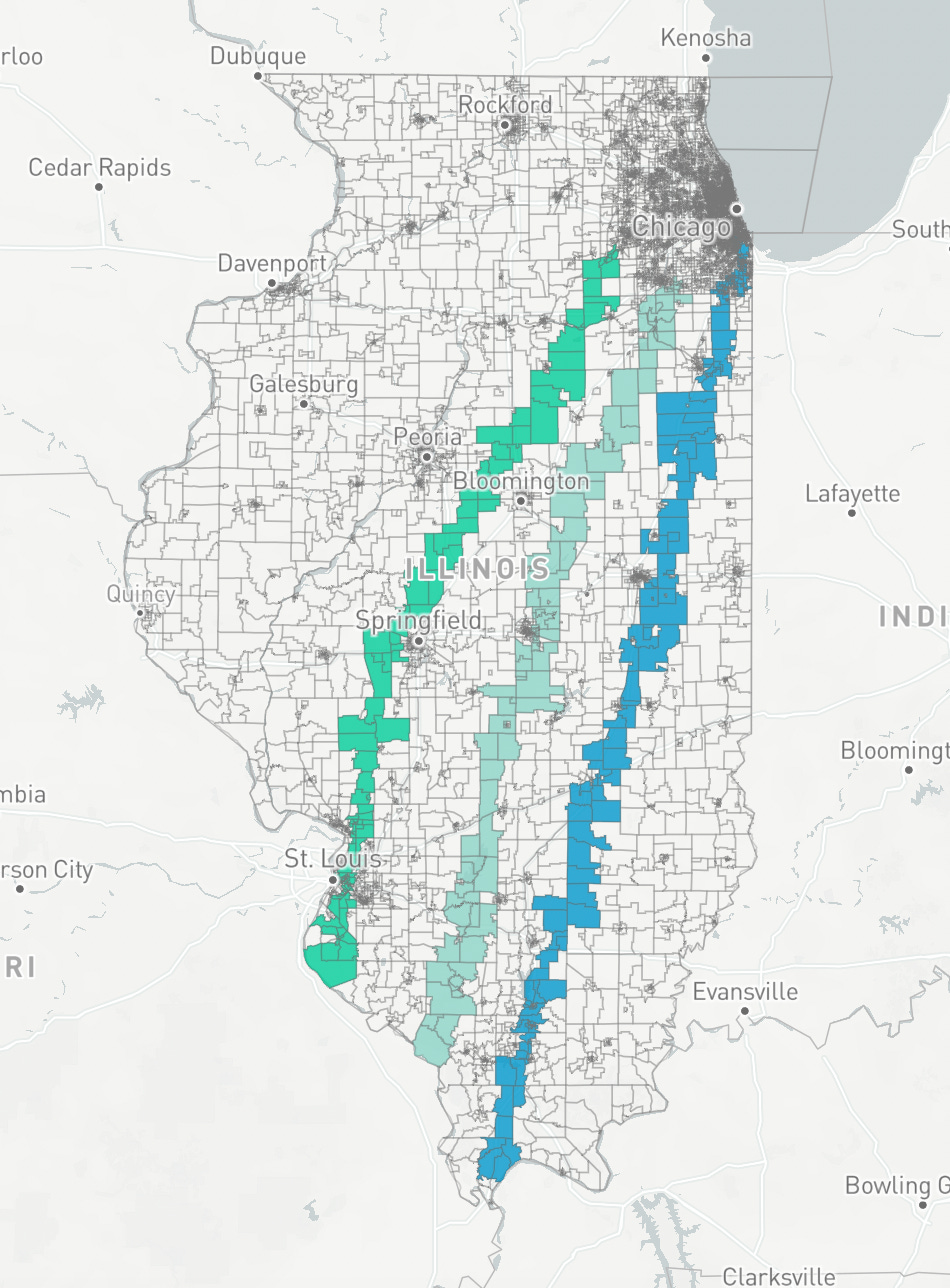
Isn’t this fun? Each ribbon makes sure to grab pieces of Chicago, then run through rural areas of the state to suppress the Republican rural vote. As you can see, this isn’t good for anybody. But Democrats will now have no choice but to participate in these ridiculous redistricting wars, just like they’ve had to participate in Super PACs and mega donors thanks to another Roberts Court decision, Citizens United.
On to Savannah
Not satisfied with taking Atlanta out of the next election, I set my sights on Savannah, because it, too, leans heavily democratic and has a large Black population. Let’s take a look at the before and after, if you’re feeling you’re overdue for some masochism.
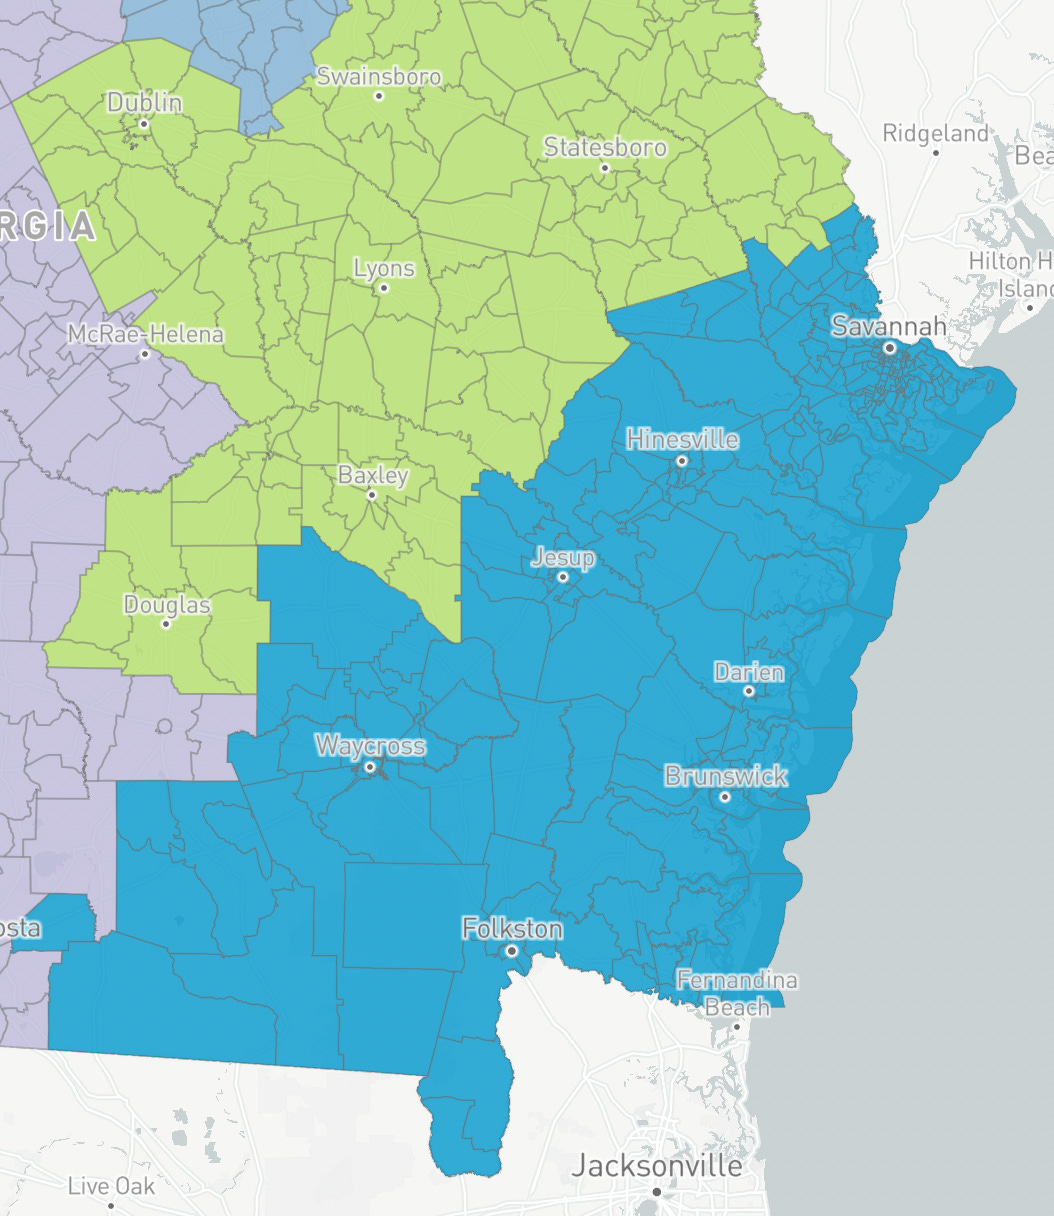
As you can see, the map is pretty clean, as red states go. Things can change quickly, though:
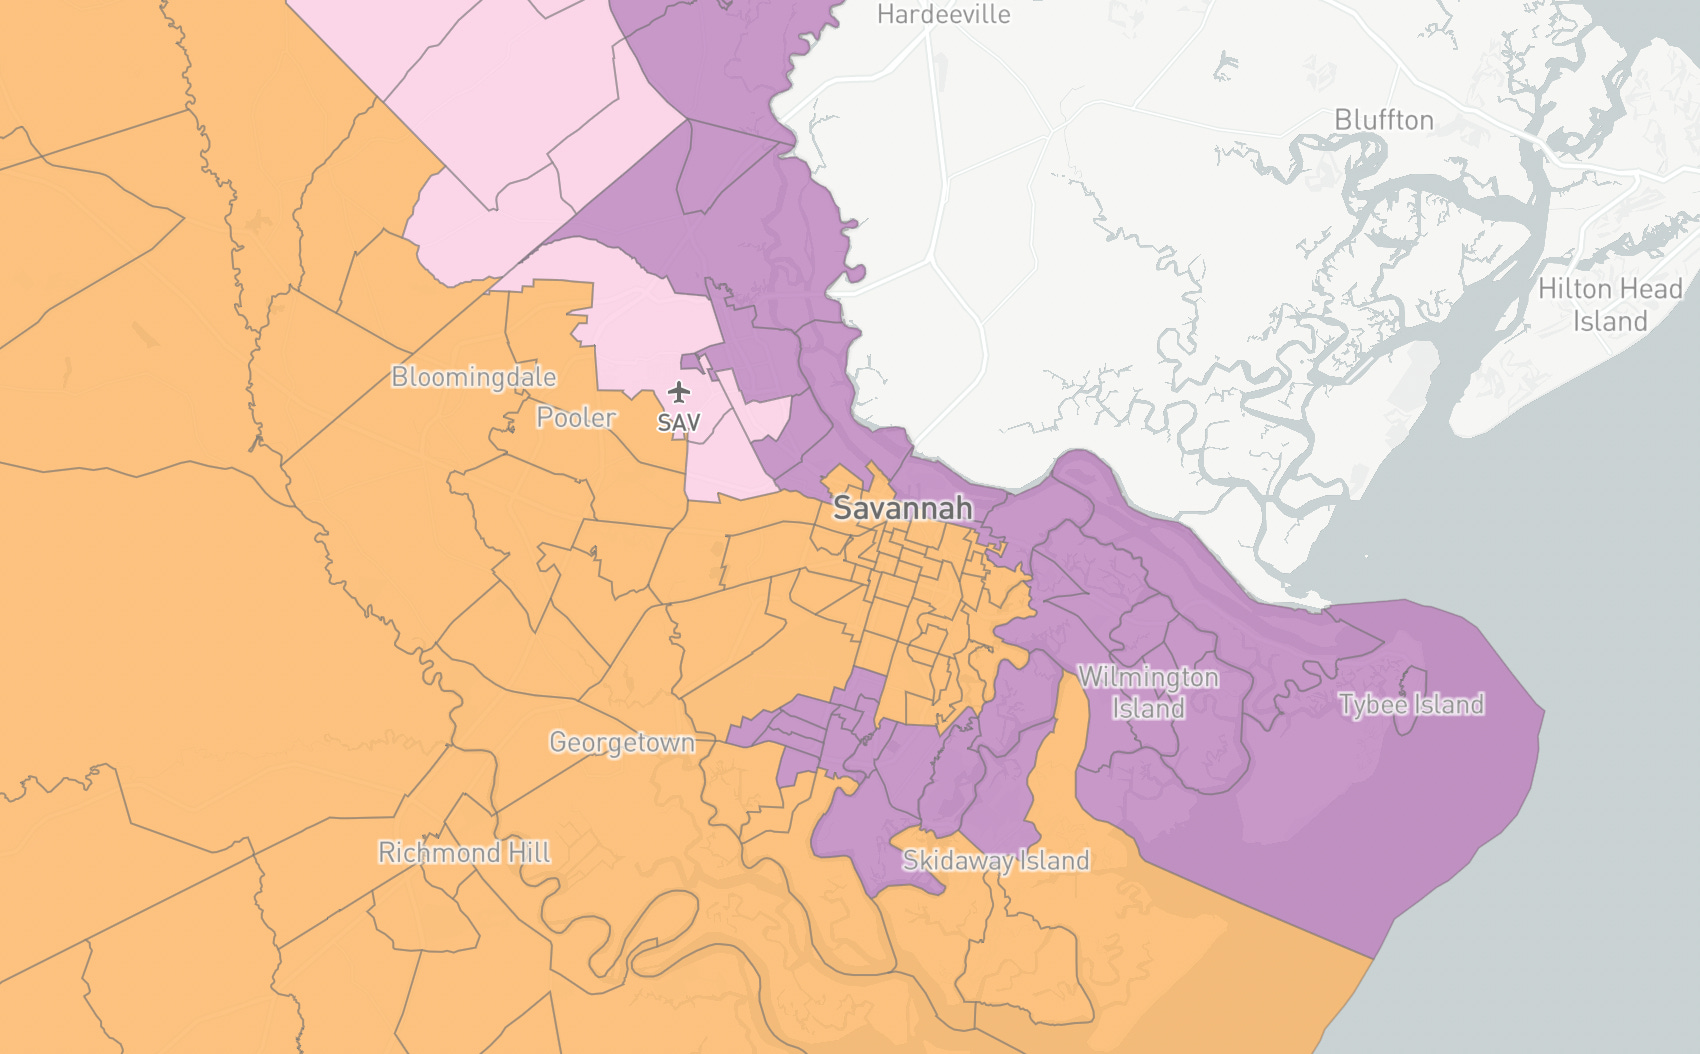
Out with the old, in with the new, as I shredded the old districts completely. What I did here was very unscientific, designed only as an example of what someone looking to redraw maps can do.
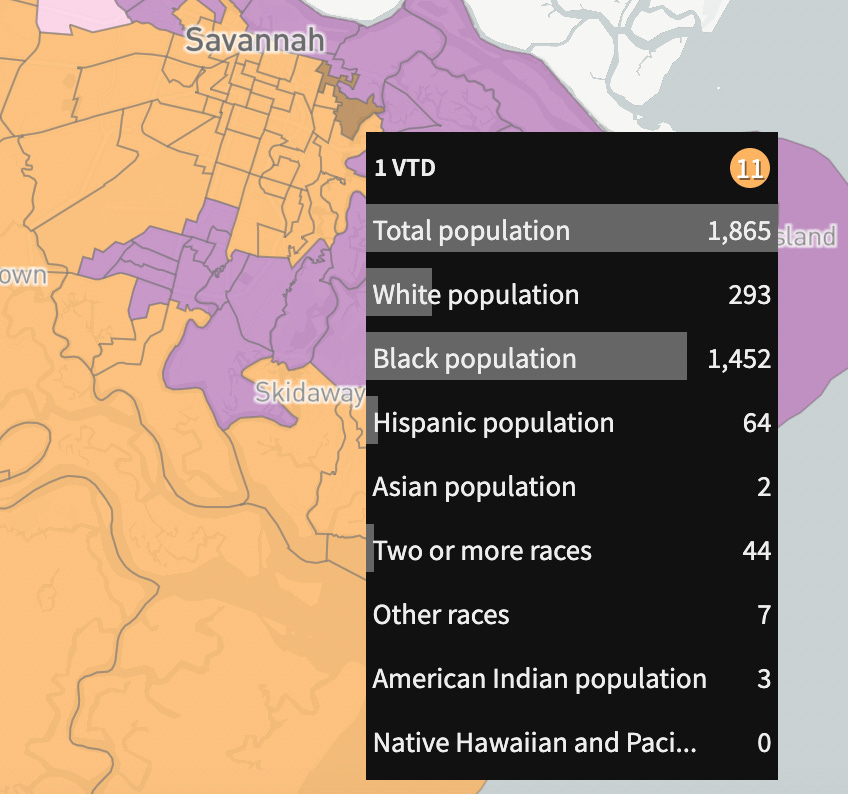
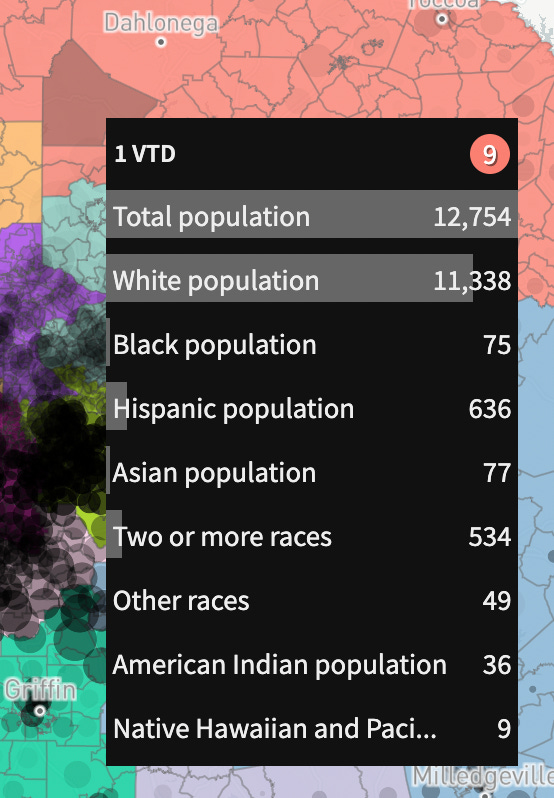
Red hatters will do a computer analysis, probably with AI. Even the online tool I used provides the information I need to make decisions based on race:
Demographic complexity runs across many parts of Georgia. This means that the state’s district maps would probably look much sillier than my final version:
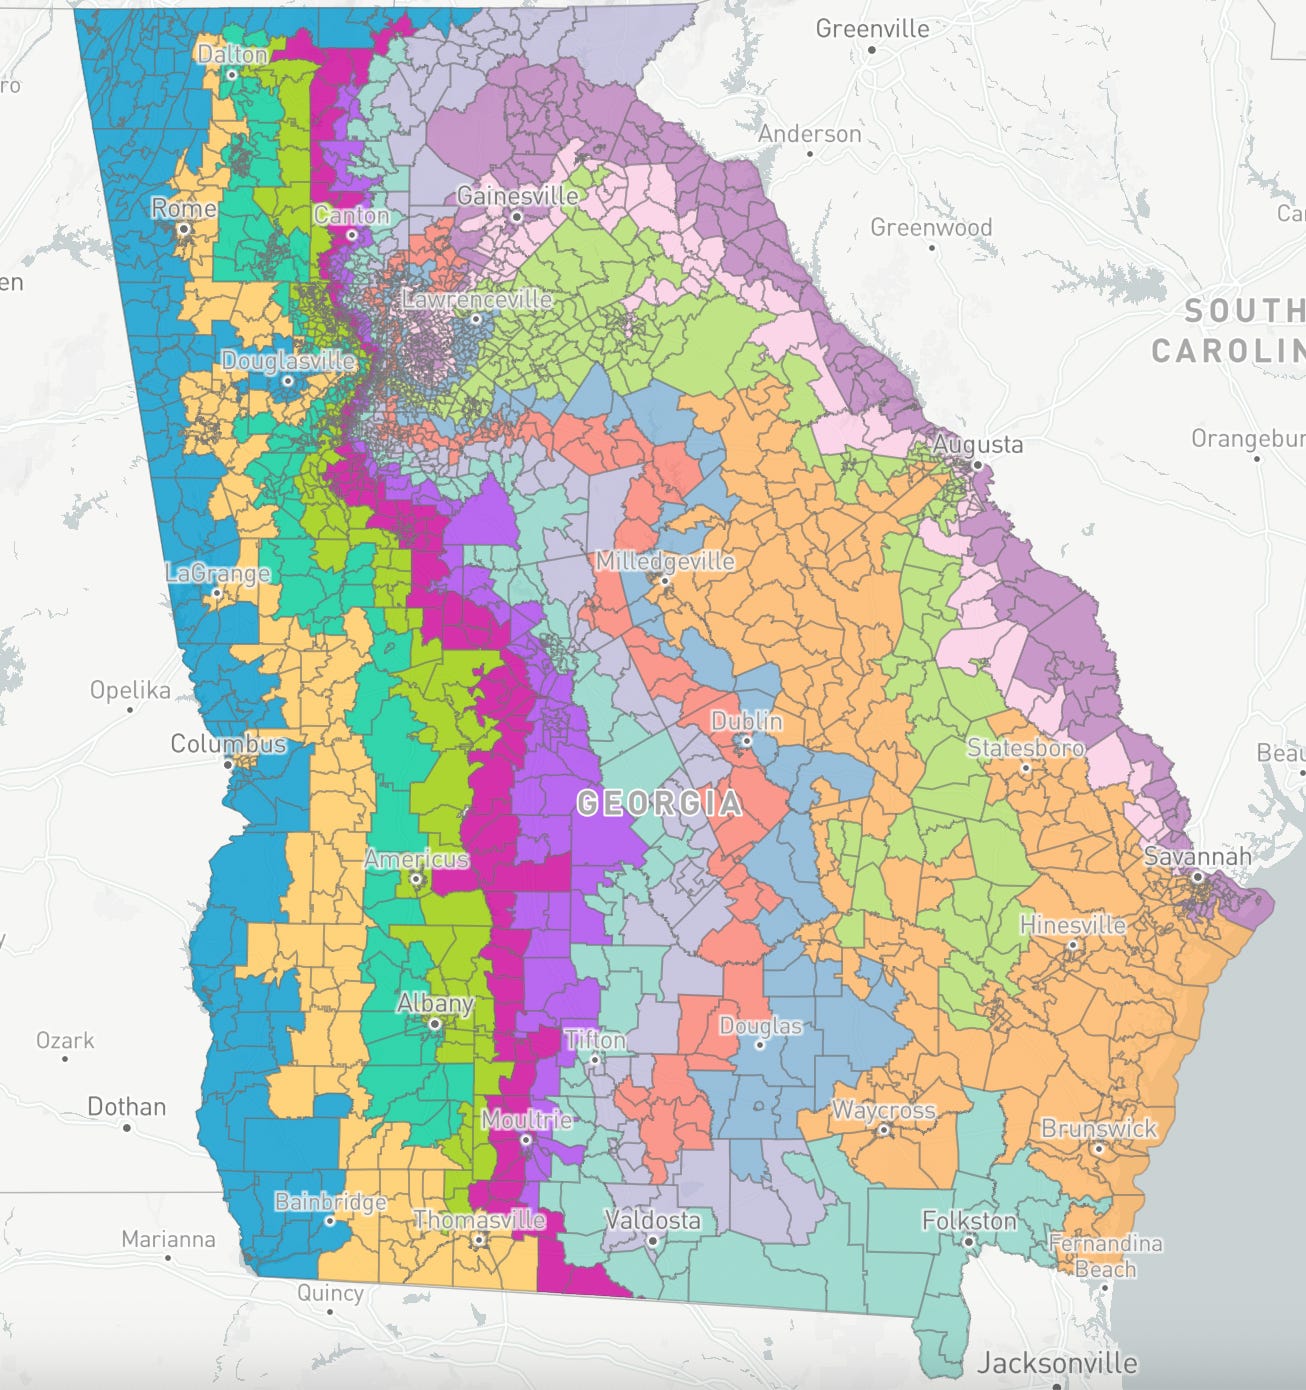
There’s a lot of zigging and zagging here to accommodate the “desired” changes. If I used AI the way that legislators will, there’d be a lot more zigging and very precise zagging.
But the fact that I was able to eyeball Georgia into a nightmare scenario for lovers of democracy in just a few hours means that these basic tools inform us that if we shoved the data the website provides into a computer like real gerrymanders will do, we’ll end up with a much more mathematically sound map. It means that legislators will be able to essentially lock Democrats out of the voting process in Georgia completely, or come awfully close.
Note: This is only true for Congressional House of Representatives elections, not Senate or Presidential elections, since those are state-wide votes.
The methodology I used
Even without inputting any data into a computer, I was able to make things interesting with the tools I had. For example, the website’s zoom tool lets you see demographic patterns by precinct:
You can also evaluate your new districts by checking how each precinct you chose voted in the previous election. In other words, you don’t have to redraw precincts by race. You can simply redraw by election results, instead. If someone tries to beg the Supreme Court to stop them, John Roberts will just shrug his corrupt old shoulders and say, “Whatever,” and check his bank account to see which Federalist Society member has hit him with some Zelle cash that week.
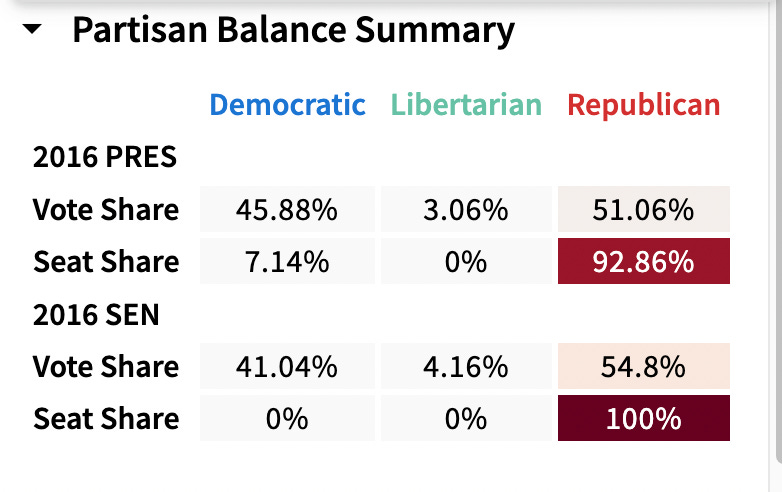
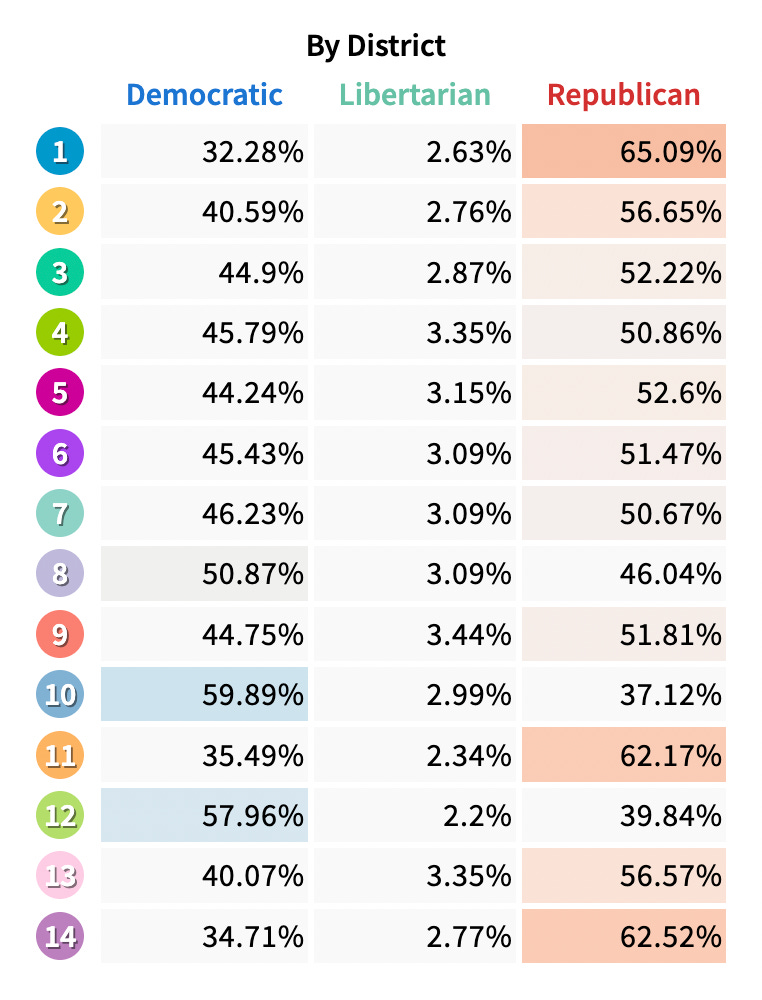
In the 2016 election, the Georgia voter gap between the number of votes Democrats received and the number of seats they won was already grotesque.
Democrats won 45.88% of the share of the vote, but only 28.57% of the Georgia U.S. House of Representatives seats because of gerrymandering. Republicans took 71.43% (according to the mapping tool). Now, they want the rest of them.
If you think that’s bad, wait until you see what I’ve done. I’ve nearly wiped out the Democratic vote entirely.
When I finished the map, these were my final estimated results for Republicans:
Vote share 51.06%; share of legislative seats: 92.86%
Given some software, AI, or even just a bit more time, I could have made it 100% for Republicans. And that’s in a tough demographic state like Georgia, which has a big mix of Black and white rural counties, along with an extremely diverse metro area in Atlanta.
It will be much easier to remove Democrats from the voting process in other Southern states.
Building the map, one ribbon at a time
To build my redistricting map, I had to first pretend I was a Republican. That was the hardest part. After that, it was just about devising a plan.
I used what I’ll refer to as a ribbon approach. This involves redrawing each congressional district beginning at the southernmost part of the state, and snaking it up to avoid or capture voting areas we want.
The first four districts
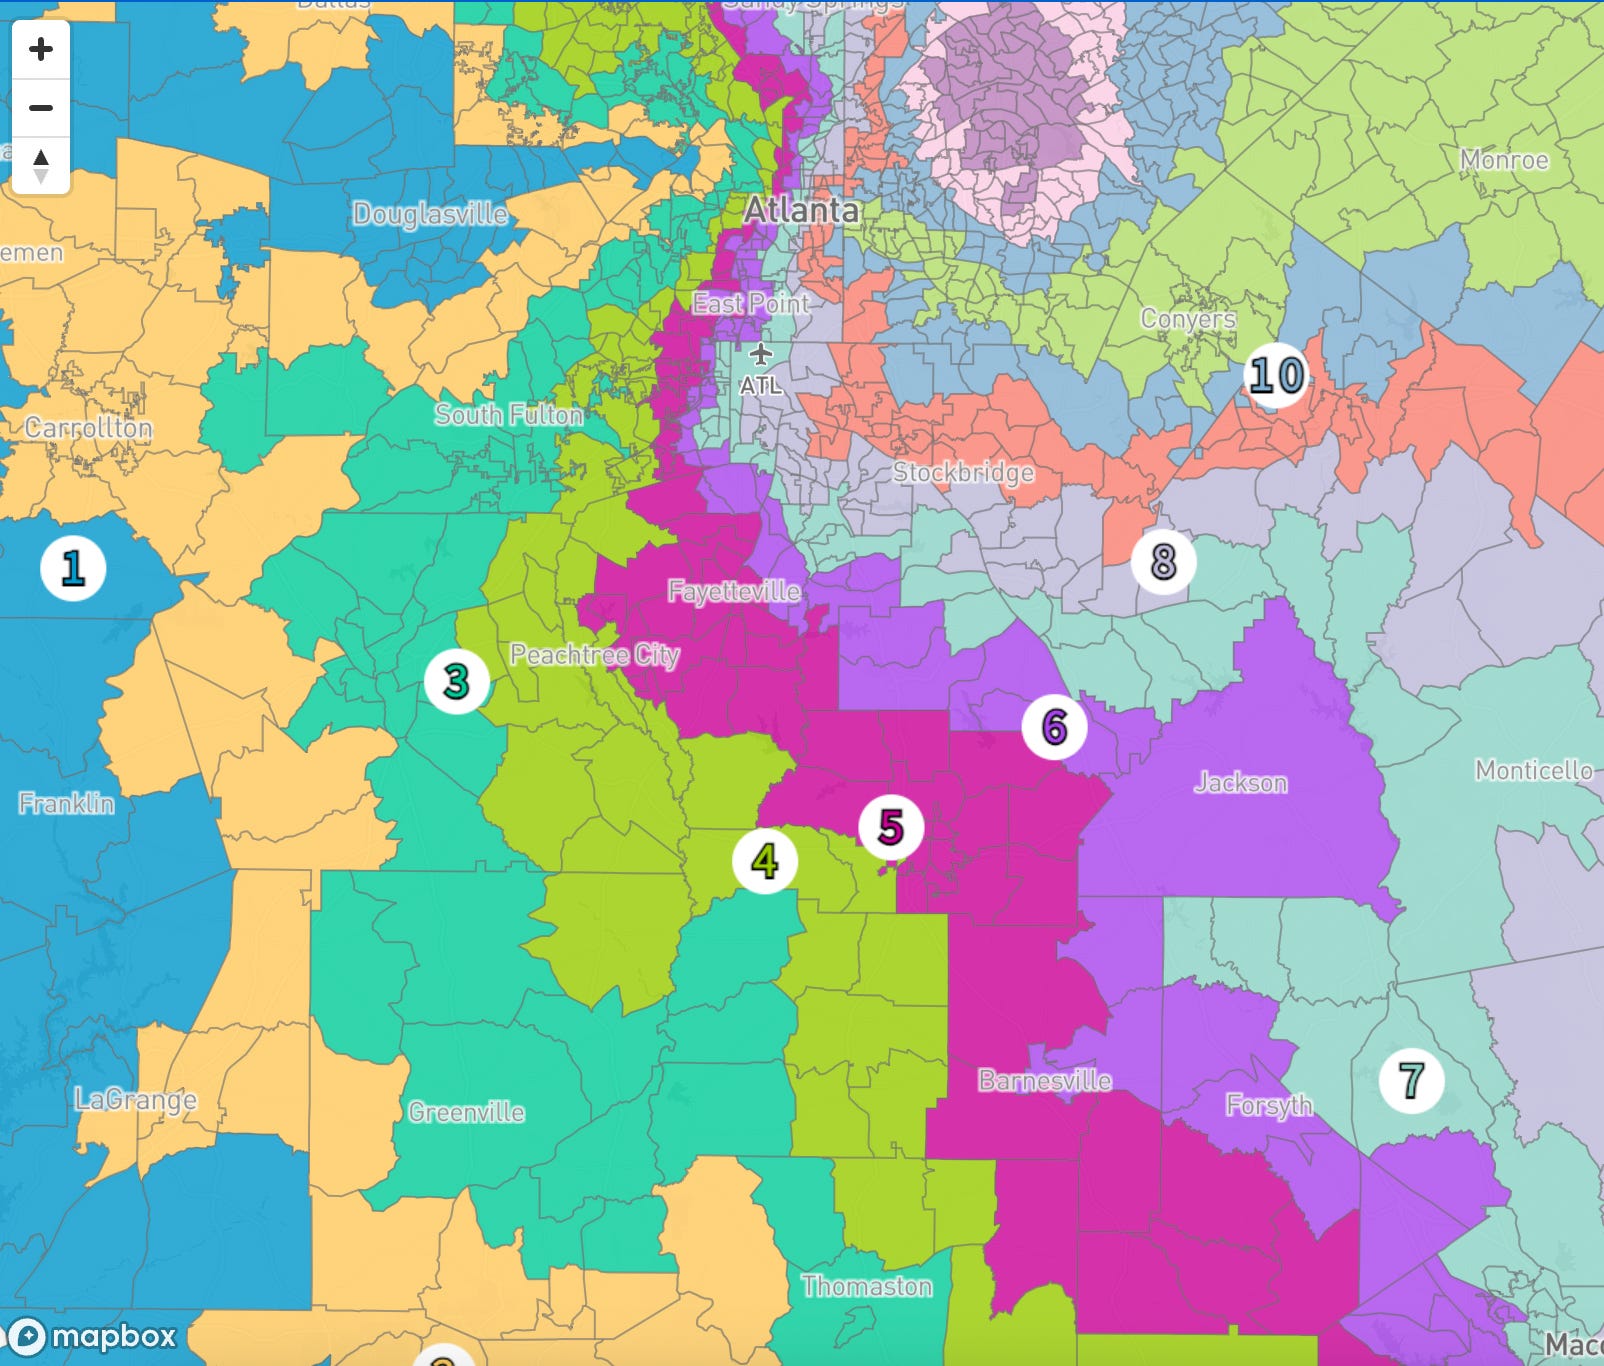
The progress after redrawing the first four districts:
As you can see, I’ve begun the process of painting all 14 congressional districts from scratch. I completely trashed existing districts. I started at the bottom so I can snake my way up later.
If I were drawing an Illinois map, I’d do the opposite, and start north, and wend my way down to eliminate Republican voters.
One of the guidelines I cheated on was population equality. The population of each district is supposed to be similar, and although most are, one of them ended up containing more than one million people, which I reduced upon cleaning up some at the end. This was almost 200,000 more than any of the others.
This district is why I didn’t get to 100% seat share. I’d need a computer to fix that, or even just more time, maybe one full day, to make the adjustments I need to make using the online tool. I love my readers, but not enough to spend eight more hours playing a Republican racist jerk.
Besides, would a challenge to unevenly populated districts survive a Supreme Court test? Not if it’s something that hurts Blacks. This is an openly racist Supreme Court. They made this clear with their 2023 Affirmative Action ruling and have cemented their historical legacy by gutting the Voting Rights Act.
Before they gutted voting rights, the Roberts Court gutted Affirmative Action
The Callais decision was the climax of a decades-long effort to end civil rights in America. We can’t really avoid talking about this without doing a quick sidebar on Affirmative Action.
Supreme Court Chief Justice John G. Roberts Jr., writing for the 6–3 conservative supermajority, said on Jun 29, 2023, in Students for Fair Admissions, Inc. v. President and Fellows of Harvard College, that collegiate affirmative action programs violate the Constitution because they “unavoidably employ race in a negative manner” and “involve racial stereotyping.”
This should sound familiar to anyone reading the Callais decision.
The Supreme Court has appointed itself as the arbiter of civil rights progress in America, even though its only job is to evaluate the constitutionality of laws enacted by Congress.
In my new map, every district is redrawn following the ribbon methodology I described earlier. Each district begins at the southernmost portion of the state and will expand northwards, carefully snaking its way around “problematic” (to use a Republican term) areas in such a way that their impacts are diluted.
John Lewis’ former district, District 5, will become a distant memory. It now begins near the Florida border and will, like the others, wind its way through white rural territories as much as possible.
Here’s how the voter results should look so far after these four districts are painted, based on recent voting patterns:
Note that these are preliminary. We’ll need to make adjustments as more districts are drawn.
Taking out John Lewis’ legacy
You can imagine Georgia boys, the same ones who took out Fanni Willis,4 rubbing their hands with glee at this point.
As I paint the map to make it traverse the Atlanta area with minimal “damage,” the ghost of John Lewis puts up a fight. Because of course he does. The fight comes in the form of a “contiguity gap,” meaning that the district I’m drawing doesn’t follow its own territory without being broken up somehow by another district.
The mapping tool warns us in real time:
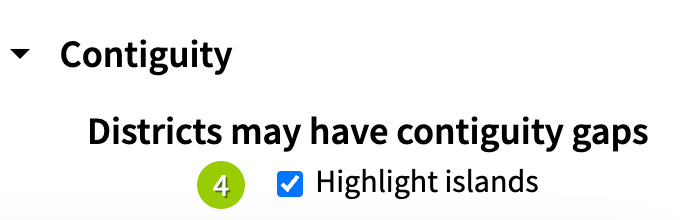
I enabled highlighting so I can see the problem. The map adds a bold red highlight so I can see the issue:
Good old John. Even a racist Republican’s gotta respect a guy putting up a fight after he’s joined the heavenly angels of righteousness. But, business is business, so I’m gonna “fix” the issue and move on.
Since the issue is with District 4, all I need to do is push John’s district out a tad. I’ll run into these problems throughout the map-making process, but fixing them is as easy as fingerpainting a bad copy of George W. Bush farting in a bathtub.
The trick (Illinois map redrawers take note) is to hug the ribbon as close to its neighbor as possible. Sometimes this means adding an extra precinct when the ribbon is held together by precincts that are only touching each other at the corners. Easy peasy, just add a precinct, and keep climbing north.
The Marietta problem
The soccer moms in the northern Atlanta suburbs of Marietta have become a problem for Republicans during the last few elections. That problem is now eliminated by two long ribbons that cut through the area like a pit viper slithering through tall grass:
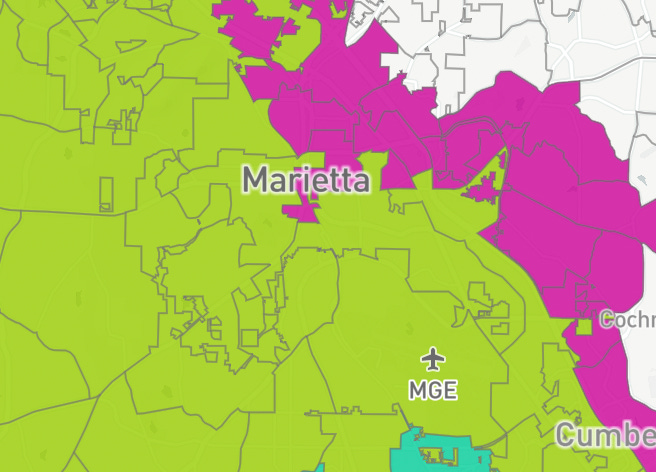
This is what John Lewis’ old District 5 looks like after I complete the ribbon (the purplish one in the middle):

The mapping tool tells me that the population for this district is only 385,345, so that will need to change. But for now, that’s where it’s at. My next move is to start building District 13.
In war, this process is similar to what is commonly referred to as a pincer movement.
And folks, we are definitely at war. We are all fighting an insurrection that officially began on January 6, 2021, and has, so far, culminated in a coup d’état. There is no way to sugarcoat this or pretend otherwise. Not anymore.
I built a ribbon in the west and cut through Atlanta using John Lewis’ ruined District 5. Next, I will move to the east and build another ribbon and snake it up north. I’ll continue this process. East, then West, then back East again, until the two sides meet in the middle.
The Savannah problem
If you’re a Republican, when your ribbon meets up with Savannah, you’re thinking, “That damn city has always been a problem for us,” even though it isn’t a high population center. Like any good Republican, we get greedy thinking, “Well, since I can’t nuke the place (yet), I can just poke it with multiple ribbons because we need to dilute the Black vote wherever possible.” So that’s what I do here:
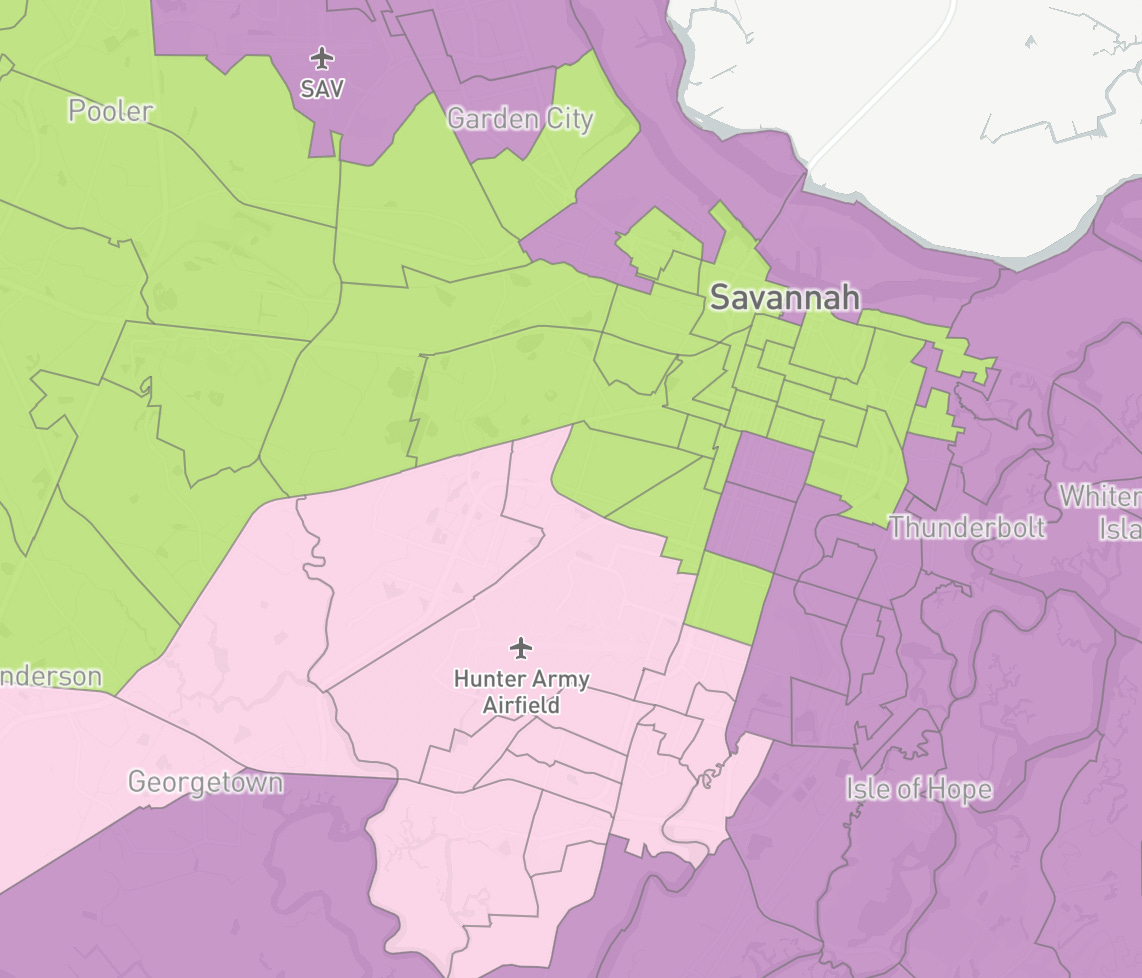
I know. It looks like I’ve done this map redistricting thing before. I swear to God, I haven’t. The tool is just that easy to use. You can eliminate voting rights in a matter of hours with a tool like this.
And I have the added advantage of being a fiction writer who (and this part is a little scary) enjoys creating evil characters.
In this case, a diabolical Republican mapmaker.
The next ribbon, District 13, is now complete, for now. It has a low population, so I’ll need to fatten it up later.
This process continues until all the ribbons are complete.
Note: In retrospect, I think would have started everything from Atlanta, and flowed out from there. See the Notes for a map that takes that approach.
Observations on the remaining ribbons
Macon, Georgia, gets cut in half by Districts six and seven, because of Black majority population centers in some precincts.
This principle applies wherever possible throughout this scorched-earth gerrymander campaign.
Atlanta, of course, continues to get punished for its demographics.
The ribbons are set, time to tie the bow
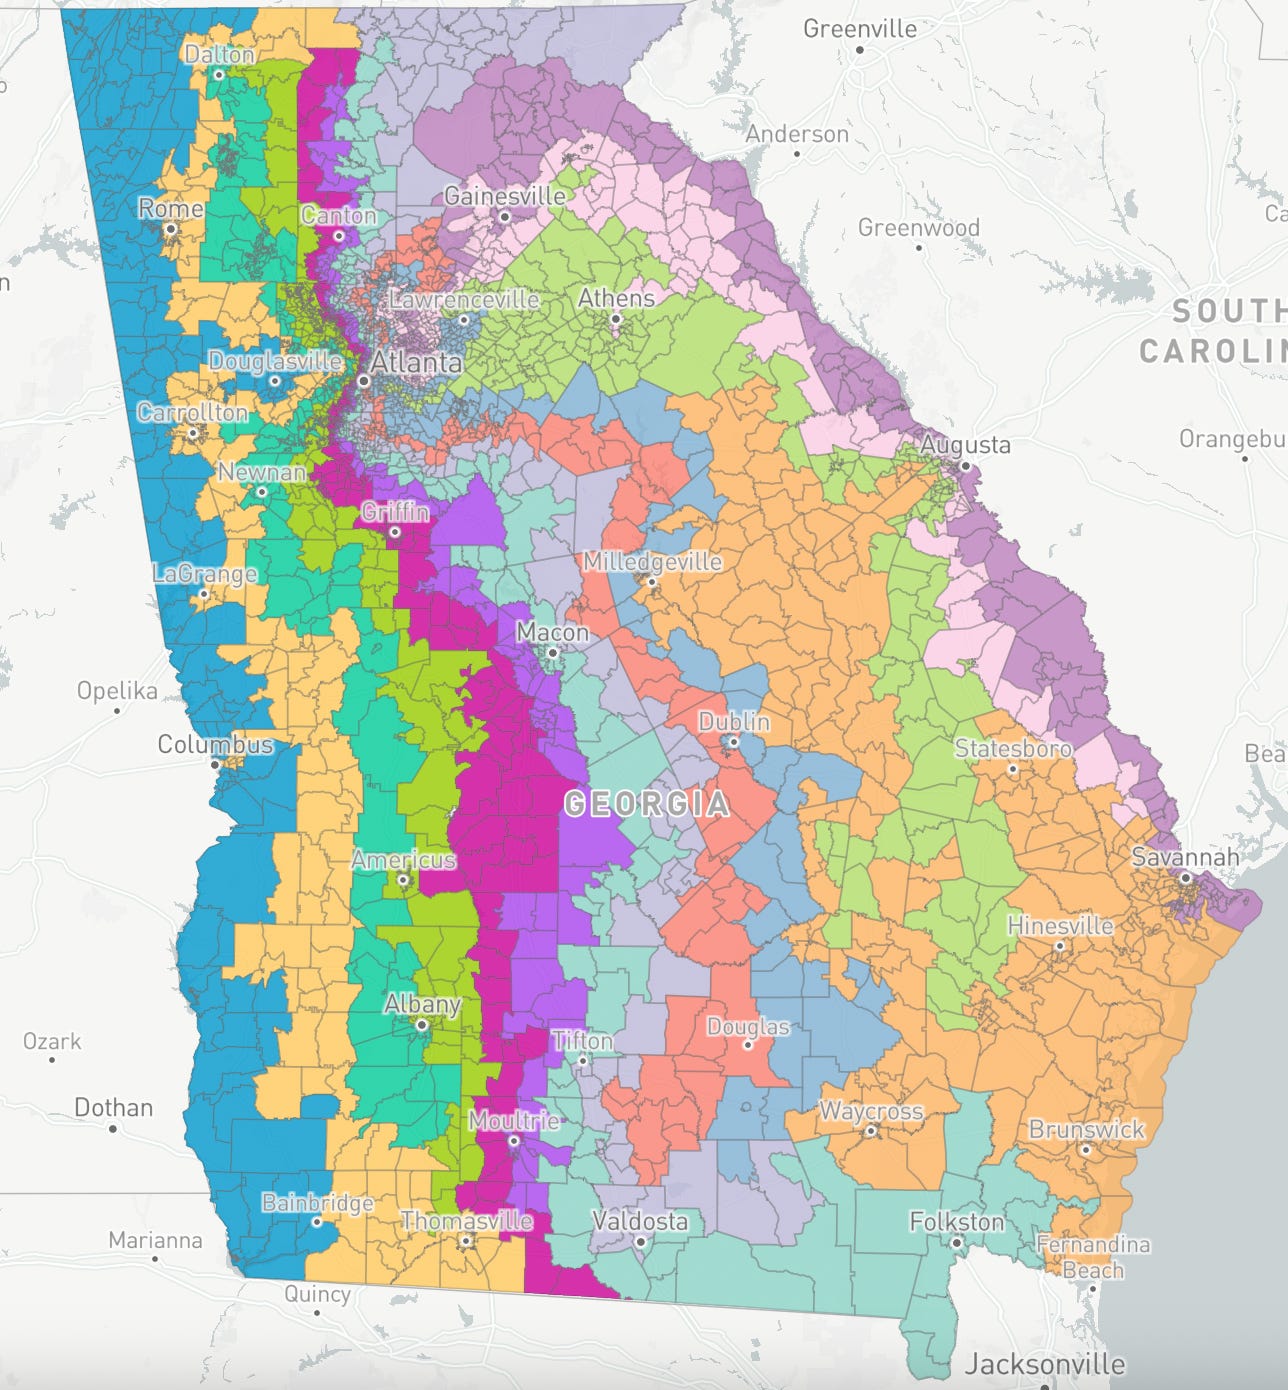
All 14 districts are nearly complete, with a few gaps to fill. Here’s how it looks so far:
However, although the vote totals look good in general based on prior results, as a putrid Christo-nationalist, I’m not happy at all with the weights of these percentages. I’ve got a lot of work to do:
Especially District 12. That’s a crisis. Time to roll up the sleeves and get those gerrymandering snakes a slitherin’.
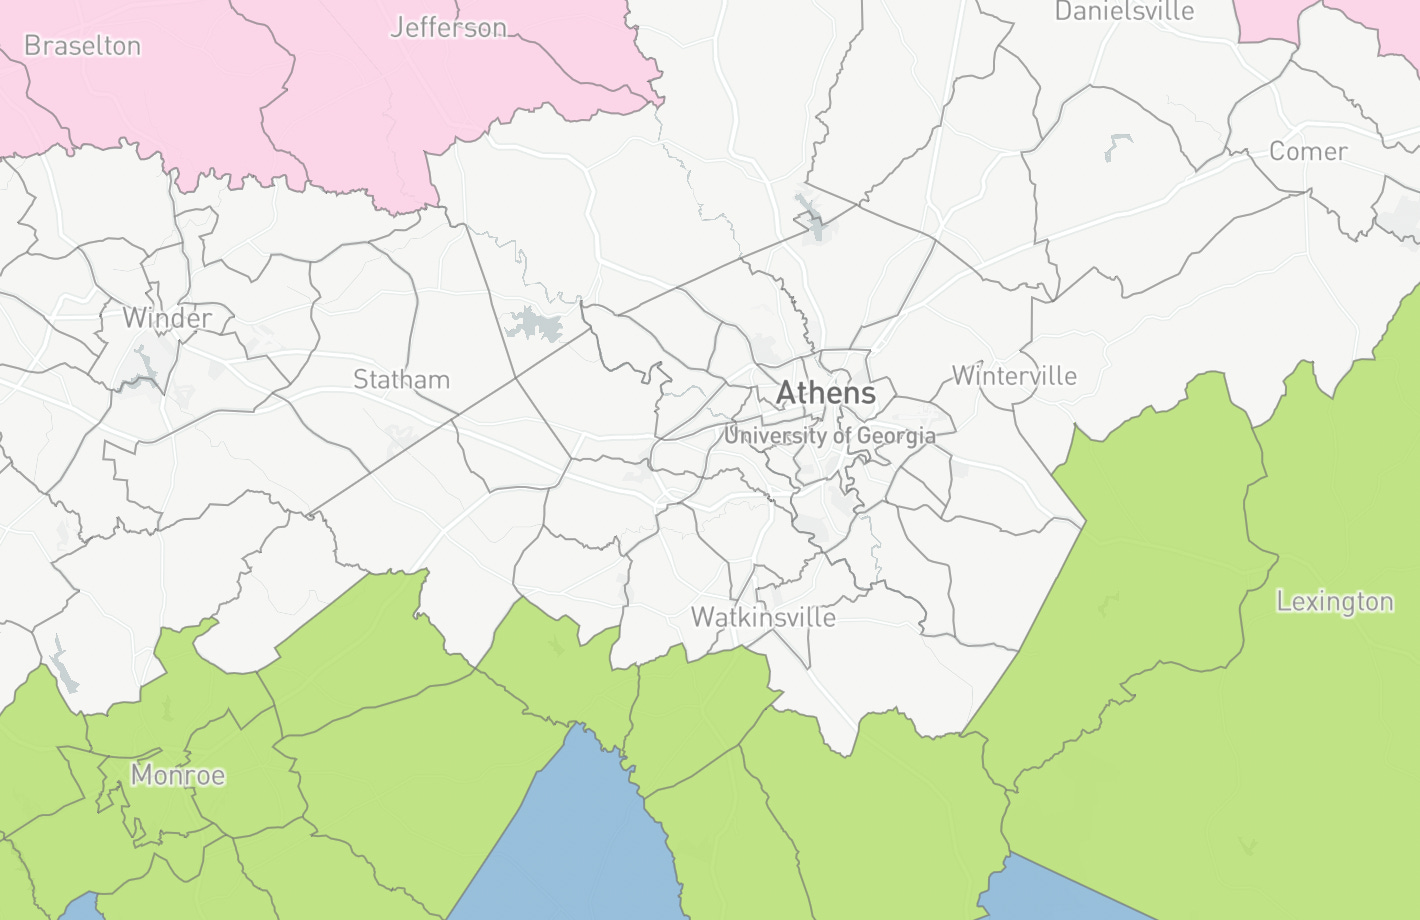
Luckily, a lot of the area around District 12 is still unassigned. I’m in luck. One of those areas is the Athens area, which is full of commie college kids. I have multiple ribbons available, so I can cut right through that campus area to dilute it. The clear precincts below are areas that still need to be assigned:
After I fill in those gaps, the Republican vote is still only at 45.9%. I must become more diabolical with my mouse clicks. After another hour or so, I’m done.
Cleaning up
To tie the bow, I do a little cleanup. Since this is just a test, I won’t worry about being perfect. But I want to at least knock that district with a million plus in it below a million to make it easier for the Roberts Court to pretend nothing is wrong.
Let’s end this on some good news
First off, if we can repeat Hungary’s turnout, the one that removed Trump’s pal Viktor Orban, we can end this. There is nothing more important now than getting out the vote and informing low-information voters that the midterms are existential. They may even believe you now that the warnings about Trump have become so true.
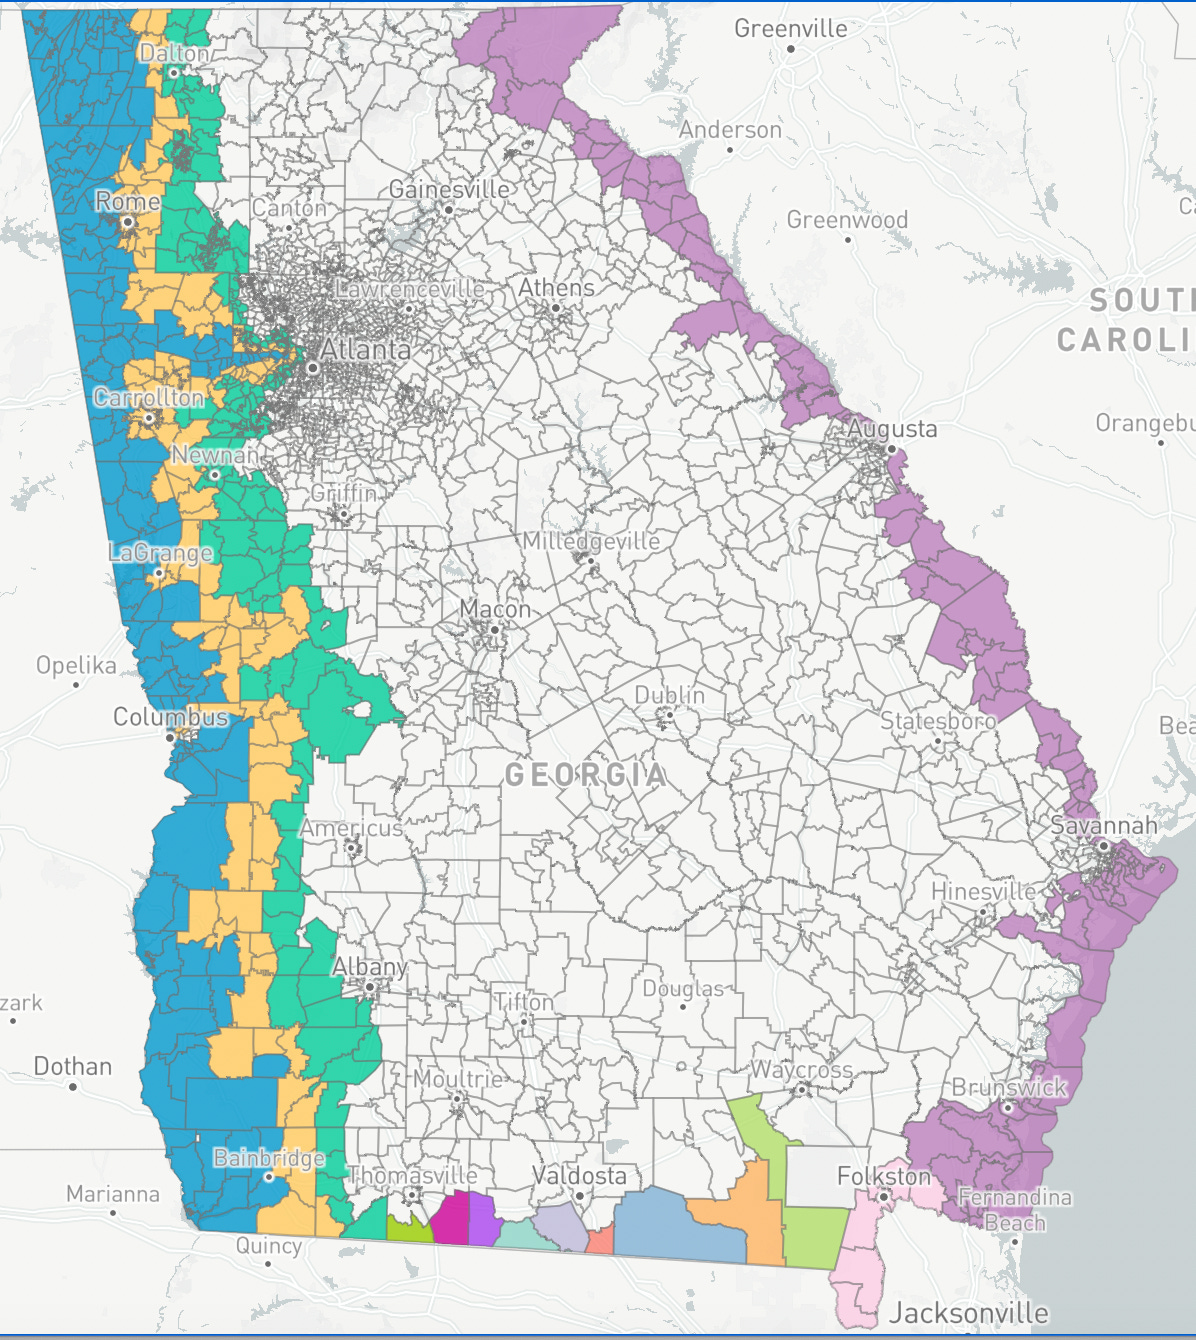
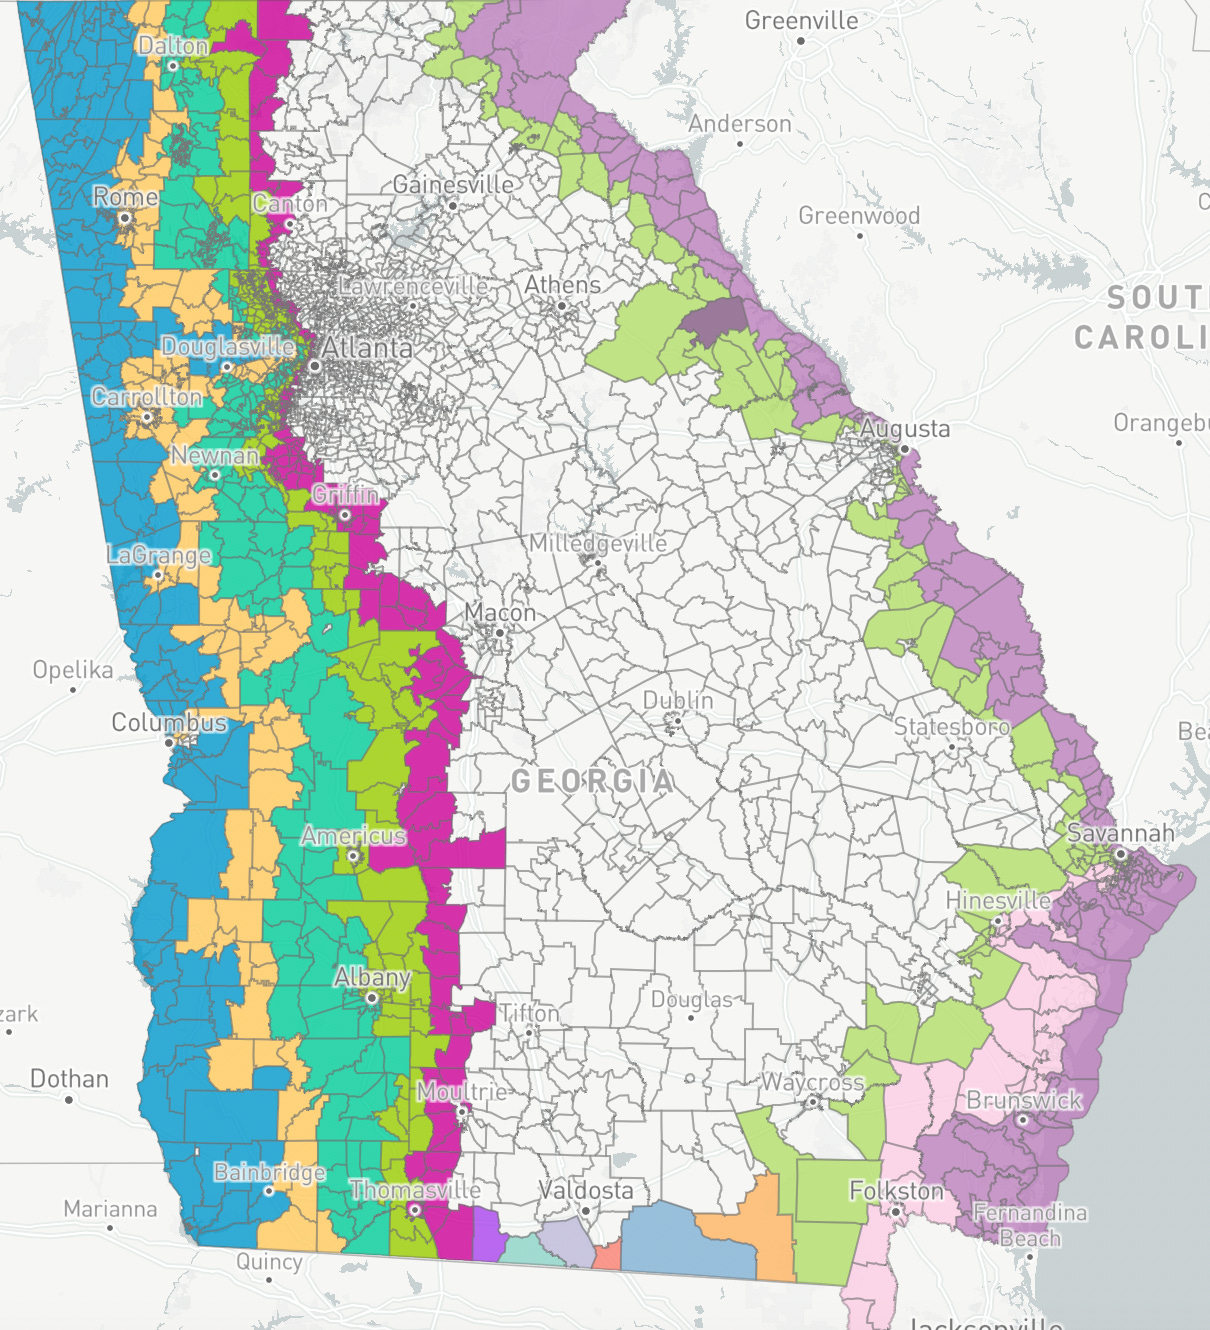
If Georgia enacted my redistricting plan, they’d probably regret it. Every district but one has a Republican majority, but the margins are razor-thin. The potential exists for Democrats to sweep the state and win all 14 districts with a map like this, my final result:
The idea here wasn’t to present a state-of-the-art map. The idea was to demonstrate how easy it will be for lawmakers to create new legislative maps for elections.
This is true for both parties, of course, which means when you see the phrase “redistricting wars,” it’s not hyperbole. It’s going to get ridiculous. From Citizens United to basically removing the Voting Rights Act from the lawbooks, the Roberts Court seems hell-bent on destroying the electoral process.
It’s a rogue Supreme Court. The only solution is a radical change, such as increasing the number of Justices to 20 and instituting term limits, just for starters.
John Roberts doesn’t seem to care that his historical legacy will be as the overseer of the end of the Supreme Court as we know it, and as the man who tried to overturn democratic institutions throughout his tenure.
For more on the corruption of the U.S. Supreme Court under John Roberts, read my story on who owns the Supreme Court’s far-right justices:
The Federalist Society’s War Against Americans

Note: This substack article may be too long for your email. I recommend you click the title or "View entire message" and read it on the web. Thanks!
As if to make clear the Supreme Court’s partisan hackery, the Contrarian reports that the six justices who voted to end voting rights for minorities in America in Callais attended Trump’s state dinner for King Charles the day before the ruling.
Notes
The major disadvantage of using the ribbon approach is that constituents in the northermost parts of a district will often have different needs from those in the southern parts. But politicians have proven to be resilient warriors against the needs of the people they govern, so this is not really a consideration for gerrymandering mapmakers.
Another disadvantage is that the ribbon method is also more likely to produce districts with tight electoral margins.
The major advantage of the ribbon approach is that you can dilute the vote of those pesky collar counties that have swung into the blue. If you’re redrawing Illinois (for example), you can take the opposite approach and build your strength up in the vast Chicago metro area and hammer the rural parts of the state south of Kankakee, while making sure to strategically leverage the few blue islands in corn country, like Champagne and Carbondale, which are college towns.
Viewing the maps I made
You can find the map I made here, along with some of the progress as I worked on the map:
Version 1.0 — vote share 51.06%; seat share 85.71%
https://districtr.org/plan/381438
Version 2.0 — vote share 51.06%; seat share 85.71%
https://districtr.org/plan/381576
FINAL Version — vote share 51.06%; seat share 92.86%
https://districtr.org/plan/381734
Still very flawed. It’s an experiment.
Version 4.0 — — vote share 100%;
This is possible, but I’d need AI or some other computer analysis tool to help me. Or just more time.
The Atlanta Map
I started a map based in Atlanta that flows outward here:
https://districtr.org/plan/381906
I have no idea if it would work.
You can take any of my maps and edit them to create your own map and link, but hopefully, you have better things to do with your time, like making one for a blue state that shuts out conservative voters.
Anytime you begin a new browser session with a map like those I’ve listed, the software tool at districtr creates a new link and map when you save it. You don’t need to register or send them your email to start a map.
Make your own maps
For example, you can create a map of Illinois with the goal of having no Republican congressional seats.
https://districtr.org/illinois
Hot tip: You can manually enter the state name of your choice after https://districtr.org/
Or, just go to
And click the top menu item that says “Jump to the map.”
And click the state you want to create a map for.
A note for visually impaired readers
I’m visually impaired, too, so my apologies for not making this post more visually-impaired-friendly. I’ll work on a more visually-impaired version if someone asks for it.
The short version for visually impaired users is that the maps all show districts with long ribbons of territory from north to south.
Thanks for reading!

Footnotes
Joyce Vance describes what happened:
Although Wednesday’s ruling did not strike down Section 2, which the plaintiffs, white voters, and the state asked it to do, it might as well have. Justice Kagan pointed out in her dissent, joined by Justices Sotomayor and Jackson, that the majority opinion left it “all but a dead letter.” Until now, states like Louisiana understood they could consider race when drawing election maps to ensure they complied with the Voting Rights Act, which was meant to guarantee Black voters had the same right and ability to participate in elections as white Americans did. The plaintiffs here were a group of “non-African American” voters who challenged maps meant to achieve those goals, claiming they constituted racial discrimination against those white voters. Justice Alito wrote for the majority that “allowing race to play any part in government decision-making represents a departure from the constitutional rule that applies in almost any other context.” You can read the full Supreme Court opinion here.
“The Constitution almost never permits the Federal Government or a State to discriminate on the basis of race,” Alito says, rejecting the argument that to combat racial discrimination against Black voters, courts had to consider race, which seems uncontroversial. Not so, according to Justice Alito, who wrote that it was not appropriate to add “compliance with the Voting Rights Act … to our very short list of compelling interests that can justify racial discrimination.”
Writing in dissent, Justice Kagan explained why that made no sense. “Even after the Fifteenth Amendment banned racial discrimination in voting, state officials routinely deprived African Americans of their voting rights. Through a seemingly boundless array of mechanisms—most of them facially race-neutral and among them the drawing of district lines—States either prevented Black citizens from casting ballots or ensured that their votes would count for next to nothing. The Voting Rights Act was meant as the corrective,” she wrote.
The dissent explains that while Section 2 technically remains in place under the majority opinion; it’s now virtually impossible to prove a Section 2 claim.
Joyce Vance is a former federal prosecutor who has argued cases to the Supreme Court. I recommend a full reading:

Although, who knows? Maybe the Roberts Court will rule someday that legislators should use maps from the 1780s. That’s how ridiculous this new ruling is.
Fanni Willis is the Fulton County district attorney whose affair with a colleague Republican judges used to dismiss the Trump insurrection court case in Georgia. It was a blatant misdirection — Willis’ unrelated sex life (her colleague stepped down) superceded Trump’s treason because the South, in the end, is still the South, and still the apex predator of the modern version of a civil war that never ended.
This is excellent, Charles. I see what you meant about the research. 👏👏👏